
Teaching Current Directions
Teaching Current Directions in Psychological Science
Edited by C. Nathan DeWall and David G. Myers
Teaching Current Directions in Psychological Science offers advice and guidance about teaching a particular area of research or topic covered in this peer-reviewed APS bimonthly journal, which features reviews covering all of scientific psychology and its applications.
Digital-Media Use and Mental Health: A Teachable Example of Psychological Science Shining Its Light
Digital-Media Use and Mental Health: A Teachable Example of Psychological Science Shining Its Light
The past decade has featured two striking social trends:
- Soaring digital-media use, thanks to the spread of tablets, computers, and omnipresent smartphones — and to the social media, texting, web surfing, and gaming they enable, and
- Lower child and adolescent well-being, as illustrated by increasing depression, anxiety, self-harm, and suicide among Canadian, American, and British teen girls (Mercado, Holland, Leemis, Stone, & Wang, 2017; Morgan et al., 2017; Statistics Canada, 2016; Twenge, Cooper, Joiner, Duffy, & Binau, 2019).
Are those two facts of life for our students’ generation — which Jean Twenge (2017) calls the “iGen” — related? If there is a connection, is it big enough to matter? Does it have implications for parental guidance regarding daily screen time and social media use?
Aided by Twenge’s (2019) accessible Current Directions synopsis, there could hardly be a better opportunity for engaging students in thinking about how psychological science can shine its light on these vital questions. For example, students could be invited to write, and then pair and share, their answers to two questions:
To discern any possible association between digital-media use and mental health,
- How might you assess people’s mental health and well-being? Twenge reports data from studies of both positive well-being (self-reported happiness and life satisfaction[1]) and of negative emotion (anxiety, depression, and suicide attempts).
- What sorts of research could reveal whether there are (a) associations, and (b) causal connections between digital-media use and people’s mental health and well-being? If you were a researcher, how might you explore these questions? Possible answers include:
- Correlational studies asking: Is digital-media use associated with mental health?
- Longitudinal studies asking: Does today’s digital-media use predict future mental health?
- Experimental studies asking: Do volunteers who are randomly assigned to reduced digital-media use fare better? That is, are they happier? Less depressed? Less lonely? Healthier? Less prone to misinformation?
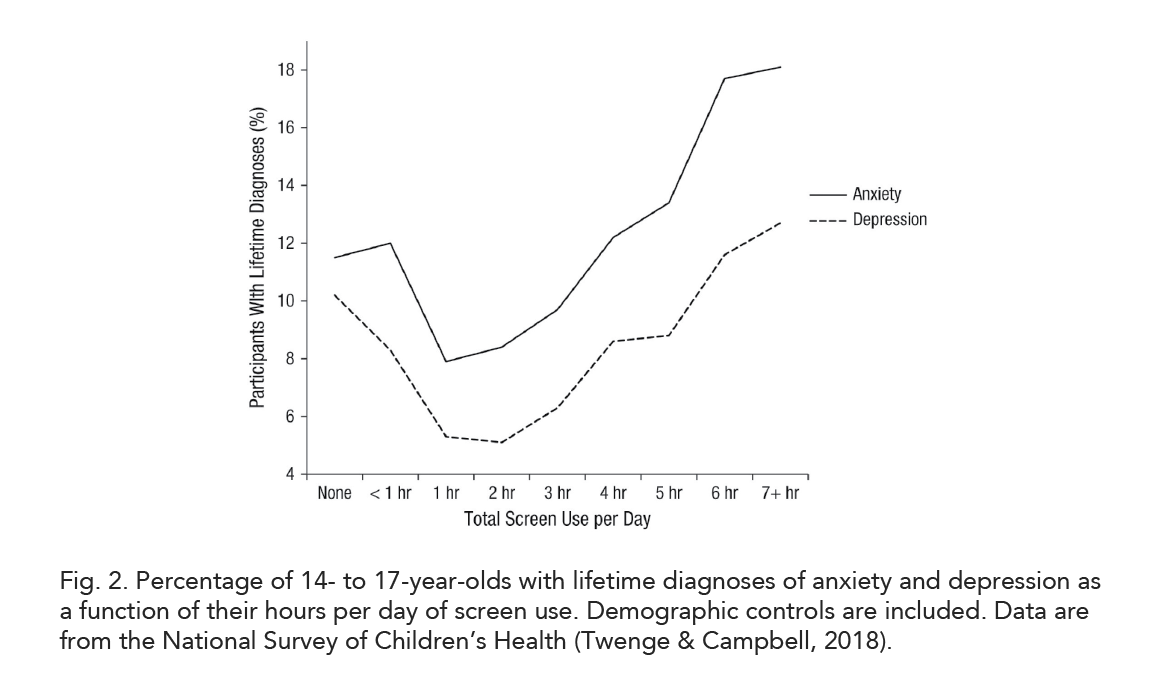
Those are, indeed, the methods by which researchers have explored possible links between these two social trends. Twenge (2019) focuses primarily on correlational studies, some of which have reported little linear correlation between screen time and mental health. In response, Twenge reports large surveys showing a curvilinear relationship — with self-reported light users (0.5 to 2 hr daily) exhibiting less anxiety and depression (and more happiness) than nonusers, but with the heaviest users (6 to > 7 hours) exhibiting the most anxiety and depression overall. Her Figure 2 illustrates these findings:
Twenge also critiques correlational studies that
- did not control for face-to-face time (which is often somewhat higher in those who text and video chat, rather than spending hours gaming and web surfing),
- were conducted before the spread of smartphones (and today’s elevated screen time), and
- used imprecise reporting usage categories (such as “never” or “almost every day”) rather than reported hours — or, better yet, app tracker hours.
In response to critics who note the small effect size — that is, the small percentage of well-being variance associated with digital-media use — Twenge argues that the more relevant question is this: What well-being difference is associated with different levels of digital-media use? She also recalls Rosnow and Rosenthal’s (1989) reminder that interventions that explain a small percentage of variance may nevertheless halve negative outcomes.
Here’s another question for class brainstorming: If indeed there is a curvilinear correlation between daily hours of digital-media use and mental health, what might explain the association? Possibilities include the following:
- Lower well-being causes more digital-media use. Might unhappy people spend more time alone, on screens? If so, longitudinal studies should find that misery predicts future screen time. But, Twenge reports, most such studies do not find this. Moreover, negative well-being increased after the spread of smartphones.
- More digital-media use causes lower well-being. Experiments that manipulate screen time find that, indeed, limited screen time decreased loneliness and depression.
Final question: Why might very high levels of digital-media use lower well-being? Again, students may anticipate some possible mediating influences:
- Time drain: Six or more daily hours of screen time surely displaces other activities — including sleep, face-to-face conversation, exercise, reading, and time spent outdoors — that might be better for mental health.
- Social comparison: Social media sites may engender upward comparison of oneself with cool, happy-seeming others.
- Cyberbullying: Online harassment and disparagement is a risk factor for depression.
Psychological science is a quest for truth that combines curiosity, exploration, skepticism, and humility. It explores important questions by various available methods. It draws conclusions. It welcomes others’ scrutiny, criticism, and further evidence — and that is precisely what Twenge and Jonathan Haidt have done by curating an “ongoing semi-open-source literature review” which researchers and students can visit at tinyurl.com/MediaMentalHealth.
Their document discusses various correlational, longitudinal, and experimental studies. And mindful of their own vulnerability to confirmation bias, they have welcomed commentary by colleagues of varied perspectives. Haidt and Twenge’s “work in progress” — with its accumulating evidence, tentative conclusions, and invited dissenting views — provides an exemplary model of psychological science and intellectual humility in action.
References
Mercado, M. C., Holland, K., Leemis, R. W., Stone, D. M., & Wang, J. (2017). Trends in emergency department visits for nonfatal self-inflicted injuries among youth aged 10 to 24 years in the United States, 2001–2015. Journal of the American Medical Association, 318, 1931–1933. https://doi.org/10.1001/jama.2017.13317
Morgan, C., Webb, R. T., Carr, M. J., Kontopantelis, E., Green, J., Chew-Graham, C. A., . . . , & Ashcroft, D. M. (2017). Incidence, clinical management, and mortality risk following self harm among children and adolescents: Cohort study in primary care. BMJ, 359, j4351. https://doi.org/10.1136/bmj.j4351
Rosnow, R. L., & Rosenthal, R. (1989). Statistical procedures and the justification of knowledge in psychological science. American Psychologist, 44, 1276–1284. https://doi.org/10.1037/0003-066X.44.10.1276
Statistics Canada. (2016). Chart 10: Prevalence of fair/poor mental health and mood disorders, female population age 12 to 19, Canada, 2003 to 2014. Women and Health. Retrieved from https://www150.statcan.gc.ca/n1/pub/89-503-x/2015001/article/14324/c-g/c-g10-eng.htm
Twenge, J. M. (2017). iGen: Why today’s super-connected kids are growing up less rebellious, more tolerant, less happy—and completely unprepared for adulthood. New York, NY: Atria Books.
Twenge, J. M., Cooper, A. B., Joiner, T. E., Duffy, M. E., & Binau, S. G. (2019). Age, period, and cohort trends in mood disorder indicators and suicide-related outcomes in a nationally representative dataset, 2005–2017. Journal of Abnormal Psychology, 128, 185-199. https://doi.org/10.1037/abn0000410
[1] In national surveys, happiness is often addressed with a simple question: “Taking all things together, how would you say things are these days — would you say that you are very happy, pretty happy, or not too happy.” Ed Diener and colleagues’ widely used Satisfaction with Life Scale is also available for class use, with norms, at labs.psychology.illinois.edu/~ediener/SWLS.html.
“She sounds nice!”
By Beth Morling
Before your first day of class, you scan your roster and find yourself jumping to conclusions. “Mona Molloy — she sounds like a kind, conscientious person,” you think. Or, “Maybe I’ll get Katie Kiplinger to lead a small group. She sounds outgoing.”
Sound symbolism is a cognitive phenomenon in which the seemingly arbitrary phonemes of words become associated with the meanings of objects. A classic research example is the “maluma/takete” effect (Köhler, 1929). When shown Figure 1, most people assign maluma (which has softer, sonorant consonants) to the rounder shape. Takete (which has harsher, voiceless-stop consonants) gets put with the sharper one. Another sound-symbolism effect shows that high front vowels (such as “tee”) are affiliated with smaller objects; low back vowels (such as “taw”) go with larger ones.
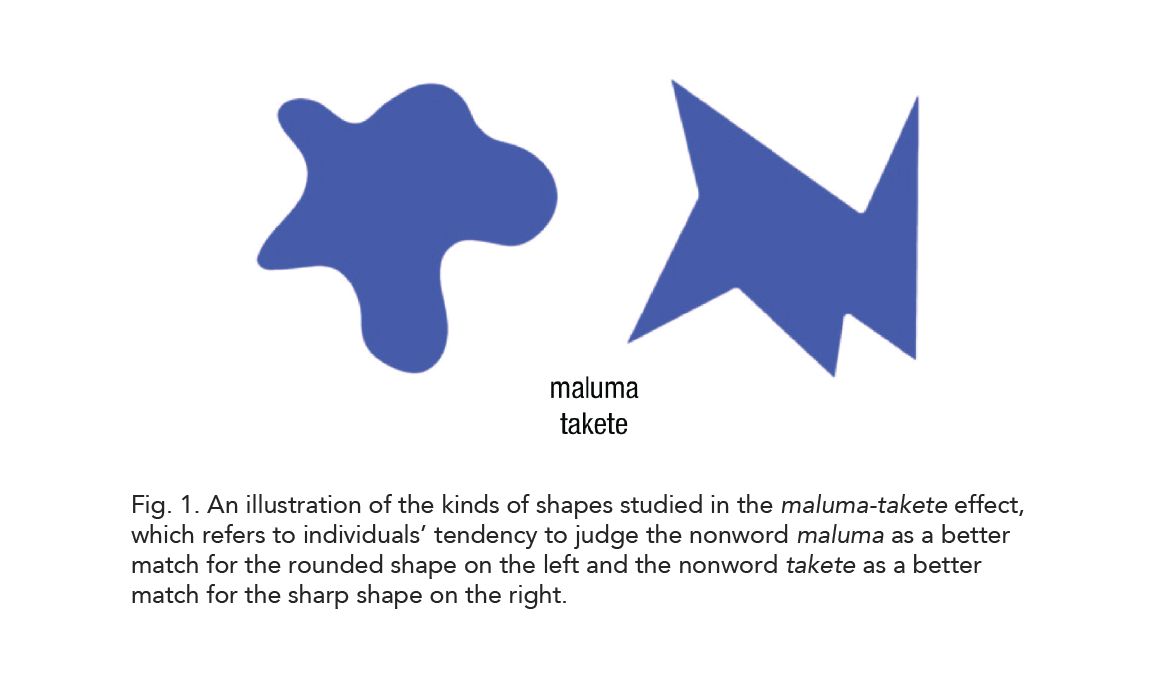
Figure 1. You can demonstrate the original maluma/takete effect with this stimulus set.
On the surface, sound symbolism introduces basic linguistic phenomena (such as phonemes and nonarbitrariness). It’s also an excellent first-day activity to introduce research, and this fascinating work provides a Trojan horse to introduce key concepts in methods and statistics such as null hypothesis testing, power, alternative explanations, and forming questions.
In Current Directions, David Sidhu and Penny Pexman describe how sound symbolism extends from abstract shapes (Fig. 1) to a social modality: people’s names. Names are useful for studying how sound symbolism generalizes because names can invite associations with new dimensions such as personality (Sidhu, Deschamps, Bourdage, & Pexman, 2019).
After showing students the maluma/takete example, you might ask: Would this effect work with people as well as objects? Show students Figure 2, asking, “Which figure is Bob vs. Kirk?” (see Sidhu & Pexman, 2015). Next, students can match names to traits using the stimulus sets in Table 1. Students should imagine that each name belongs to a person they have never met (try the slides available at bit.ly/2KP5lJ6).

Figure 2. Ask students which silhouette is Kirk and which is Bob.
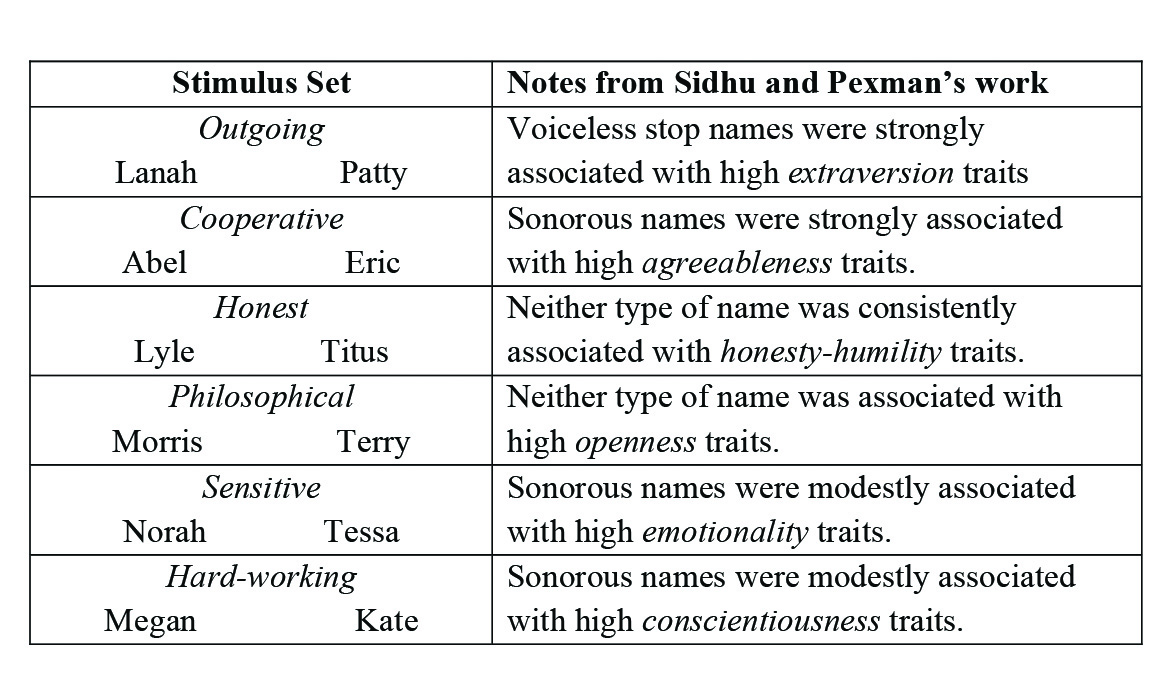
Table 1. For each set, students select which person is more likely to have the trait in the center. In all pairings, the name on the left is sonorant, and the name on the right has a voiceless stop.
Sound symbolism might be just the thing to enhance your lessons in methods and statistics.
Introduce Null Hypothesis Testing and Chi Square
Null hypothesis significance testing is a notoriously difficult concept for students to learn. The sound-symbolism effect can introduce it intuitively.
In class, use the cooperative set from Table 1. Students can collect Abel/Eric data from a sample of their peers or you can run students in your own classroom. In a sample of 30, the null hypothesis states that 15 people should assign cooperative to Abel (a sonorous name) and 15 should assign it to Eric (a voiceless stop name). If 21 or more of the 30 people assign cooperative to Abel, your results are unlikely according to the null hypothesis. Sidhu and Pexman’s Appendix provides names and traits to test — or use the slides at bit.ly/2KP5lJ6. To calculate chi square, use the second, “custom” calculator at quantpsy.org/chisq/chisq.htm.
Teach Null Effects and Power
Sidhu et al. (2019) includes a test of whether people really do have personalities that match their names (Experiment 3). The researchers tested a sample of more than 1,000 people to examine whether those with sonorous names have more agreeable traits and whether those with voiceless stop names are more extraverted. They found no meaningful relationships. In a statistics class, you could discuss why the researchers used a relatively large sample in this study (compared with the perception studies): They wanted to be able to detect even a very small relationship between name and personality.
Teach About Alternative Explanations
Participants’ previous experience with people named “Linus” (a gentle boy with a blanket) or “Katie” (a chipper news reporter) are an alternative explanation for why sounds and traits go together. To rule out this possibility, they conducted their name-pairing study again (Sidhu et al., 2019, Study 4), using invented names with the same sounds. For example, instead of responding to “Linus,” “Mara,” “Kasey,” or “Pippa,” people responded to “Nisul,” “Rama,” “Tasey,” or “Teepa.”
Inspire Wonder
The sound-symbolism effect will inspire wonder and curiosity from students, who might ask their own research questions:
- Does the effect work in other languages and cultures?
- Do famous authors exploit this phenomenon in novels and poems?
- Does this effect generalize to brand names, such as IKEA tables or new prescription drugs?
- What about names that blend sonorous and voiceless stop phonemes?
Capitalize on students’ interest by prompting them to defend their reasoning (“Why would you expect it to work in other cultures? Why might it not?”). Help them conduct literature searches for studies that may have already tested this question, starting with the references of current articles. Finally, students can adapt stimuli to test their own hypotheses (for example, a list of sonorant and voiceless stop names is available in the appendix of Sidhu et al., 2019, and a complete set of aliens with sharp and round bodies is available in this Google folder: tinyurl.com/yyguuj7z). (Ask your institution whether class-based research needs IRB approval.)
References
Köhler, W. (1929). Gestalt psychology. New York, NY: Liveright.
Sidhu, D. M., Deschamps, K., Bourdage, J. S., & Pexman, P. M. (2019). Does the namesay it all? Investigating phoneme-personality sound symbolism in first names. Journal ofExperimental Psychology: General. https:/doi.org/10.1037/xge0000662
Sidhu, D.M., & Pexman, P.M. (2015). What’s in a name? Sound symbolism and gender in first names. PLOS ONE 10(5), Article e0126809. https://doi.org/10.1371/journal.pone.0126809


APS regularly opens certain online articles for discussion on our website. Effective February 2021, you must be a logged-in APS member to post comments. By posting a comment, you agree to our Community Guidelines and the display of your profile information, including your name and affiliation. Any opinions, findings, conclusions, or recommendations present in article comments are those of the writers and do not necessarily reflect the views of APS or the article’s author. For more information, please see our Community Guidelines.
Please login with your APS account to comment.