Network Analysis

Denny Borsboom
Do you remember when you first kissed? Probably. I am pretty sure you can’t think about it without feeling something. Maybe you’re reliving the joy of it, or the awkwardness, or the excitement. It’s possible that, in addition, my question will trigger some behavioral response on your part. Perhaps you’ll talk about it with your spouse when you get home from work. If your spouse happens to be the person you first kissed, you may together recall the event with a smile. Alternatively, my question may painfully expose that whatever you shared isn’t there anymore. I certainly don’t intend to, but given the large audience of this brief essay, I cannot exclude the possibility that this innocuous introduction is causing a breakup somewhere.
 There is an important message here, namely that the human system features an extremely high level of connectivity between what we may — for lack of a better term — consider to be its “components”: thoughts, feelings, actions, social relations, etc. This idea has been a major source of tension in psychological science. Out of methodological necessity, we have often studied psychological processes in isolation; but outside our labs, almost everything is somehow connected to almost everything else. Psychological scientists have been very successful in tearing the human system apart and assessing how each part functions in isolation. But they have not been very successful at putting the system back together again.
The problem has often been noted, usually in tandem with calls for interdisciplinary integration and holistic approaches. Such calls have invariably been sterile, simply because they were not accompanied by a workable methodology. And without method, there can be no science. This methodological void, however, is quickly being eliminated in current research on complex systems and large networks. Under the rubric of network analysis, we now have a significant range of systematic, exact, and scientifically respectable methods that allow researchers to study large systems of interconnected components.
So what are networks? A network is just a set of entities that are connected through relations. Both the entities and the relations can basically be anything. For instance, by simply mapping who eats who, one can construct a food web of animal species; by noting which website refers to which other website, one represents the structure of internet connectivity; by noting which symptoms belong to the same DSM-IV disorder, one can determine the structure of the diagnostic system. In each of these cases, entities (species, websites, symptoms) are connected to each other whenever they stand in a given relation (eating each other, referring to each other, being part of the same disorder). When I first learned about the ways these networks are studied, I was excited by the simplicity of the basic material. You can just open an Excel sheet, create a row and a column for each entity, think up an interesting relation between them, jot down one whenever the row and column entity stand in this particular relation, and off you go!
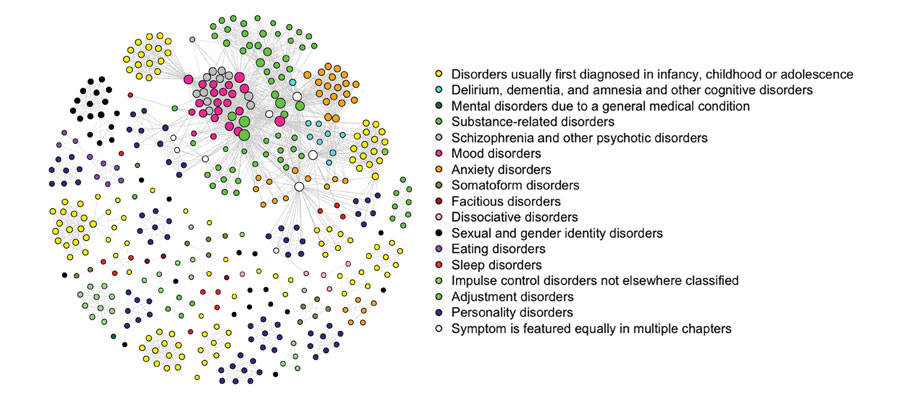
Once you have a matrix that represents the relations between entities, you can feed that to any of a number of free software platforms to represent the network visually. Figure 1 shows such a network for the DSM-IV example (for details, see Borsboom, Cramer, Schmittmann, Epskamp, & Waldorp, 2011). Often, simply visualizing the network is insightful in itself. For instance, one immediately notices the big connected component in the DSM-network, which involves almost 50 percent of the symptoms. This result means that many DSM-IV disorders are directly or indirectly connected through the pattern of symptom overlap in the diagnostic system. We have recently developed freely available software to construct similar network visualizations using correlations between variables (Epskamp, Cramer, Waldorp, Schmittmann, & Borsboom, 2011).
Going beyond the visualization, one can study, assess, and analyze networks. For instance, how large is a network? How heavily connected is it? What is the structure of the connectivity? Which of the entities in the network is most central? Network analysis offers concepts and computational tools to answer these questions. For instance, in the DSM-IV network, the most prevalent mental disorder (depression) is located dead in the middle of the big clustering component. The most central individual symptom is “insomnia.” Newman (2010) offers a good overview of measures and methods for answering questions of network structure, and Kolaczyk (2009) presents an excellent overview of statistical analyses appropriate to network structures.
In addition to visualizing networks and studying their structure, one can think about dynamics in new ways. For instance, considering the DSM-IV symptoms of insomnia, fatigue, and hypersomnia, there are clear dynamic dependencies: if you don’t get sleep over a longer period, you will get tired (insomnia -> fatigue); but if for some reason you are tired all the time, you will tend to sleep more (fatigue -> hypersomnia). So there is a danger of “infection” between these symptoms that creates an intricate pattern of interdependence that (in normal circumstances) has a stable equilibrium that we consider “healthy.” But how does a system with these properties evolve over time? How can it be disturbed, and if it is disturbed, what is the most efficient way of restoring balance? To study such questions, one can use both analytical and simulation methods. Scheffer (2009) offers an accessible introduction in the analysis of dynamical networks, and the NetLogo simulation environment contains a number of simulation methods for network models (http://ccl.northwestern.edu/netlogo/).
Finally, one can imagine charting the network structure of an individual person, for instance by representing how components like sleep, fatigue, concentration problems, and social support affect each other over time. This approach creates an entirely new way of thinking about what makes individual people tick. Individual networks could be highly idiosyncratic, in the sense that important components of your psychological ‘economy’ may be irrelevant or even absent in mine. We might need to represent the memory of your first kiss in modeling your mood structure, but for modeling mine, it might be utterly dispensable.

Figure 1. The structure of the DSM-IV. Every DSM-IV symptom is represented as a node. Symptoms are connected by an edge whenever they are criteria in the same disorder. The color of nodes represents the DSM-IV chapter in which they occur most often.


APS regularly opens certain online articles for discussion on our website. Effective February 2021, you must be a logged-in APS member to post comments. By posting a comment, you agree to our Community Guidelines and the display of your profile information, including your name and affiliation. Any opinions, findings, conclusions, or recommendations present in article comments are those of the writers and do not necessarily reflect the views of APS or the article’s author. For more information, please see our Community Guidelines.
Please login with your APS account to comment.