
Rise in Reporting p-Values as “Marginally Significant”
A researcher collects data, runs a statistical test, and finds that the p value is approximately .07. What happens next? According to a study conducted by Laura Pritschet (University of Illinois at Urbana-Champaign), Derek Powell (University of California, Los Angeles), and Zachary Horne (also at the University of Illinois), that researcher may be likely to report that result as “marginally significant” — not quite significant, but getting there. While it may be common, Pritschet and colleagues argue that this practice is “rooted in serious statistical misconceptions” and is likely to lead to false-positive errors (and sometimes false negatives, too). To make matters worse, evidence suggests that this practice is on the rise.
Pritschet, Powell, and Horne note that the practice of reporting marginally-significant results is problematic for two main reasons. First, the field of psychological science has no agreed-upon standards for how and when results should be reported as marginally significant. The second edition of the American Psychological Association style manual, published in 1974, advised, “Do not infer trends from data that fail by a small margin to reach the usual levels of significance.” This language was soon cut, however, and information about marginal significance has been absent from the manual for over 30 years.
Potentially more troubling is that reporting of marginally-significant results mixes two types of scientific reasoning: Neyman-Pearson decision theory, which relies on hard cutoffs, and Fisher’s hypothesis testing approach, in which a p value can be considered a measure of evidence.
“The concept of marginal significance is dubious under either framework,” warn the authors.
To investigate reporting of marginal results, Pritschet and colleagues examined the papers published each decade between 1970 and 2010 in three top cognitive, developmental, and social psychology journals published every decade — 1,535 in all. The authors examined each article for the reporting of a marginally-significant result, by searching for the terms “margin” and “approach,” and examined the first instance of a marginal report when it appeared.
Pritschet and colleagues found that researchers called many different p values marginal, ranging from p = .05 to p = .18. Over 90% of p values called marginal were between .05 and .10, however.
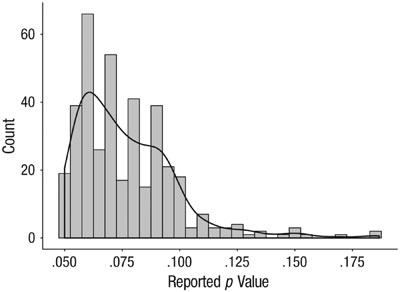
Fig 1. Histogram of p values labeled as marginally significant in the articles analyzed
Next, the researchers examined the proportion of articles that contained reporting of marginal reports, and how those proportions have changed over time. All journals showed an increase in reporting of marginal results: In 1970, 18% of articles examined described a p value as marginally significant, but in 2000, over half of all articles did so. The researchers noticed, too, that the social psychology journal was most likely to contain reporting of marginally-significant results.
In additional analyses, the researchers found that papers that reported results of more experiments were more likely to include reporting of a marginally-significant result. Even still, and controlling for this effect, the articles in the social psychology journal were more likely to report results of this type.
“We are reluctant to draw firm conclusions on the basis of these results alone,” the authors cautioned.
Pritschet and colleagues admit that the wider interpretation of these results is up for debate.
“Is the increased acceptance of marginally significant effects representative of a graded, Fisherian interpretation of p values, according to which hard cutoffs are thought to be arbitrary? Or might it suggest the emergence of a more questionable state of affairs for psychological methodology?” they wrote.
Either way, the authors advise a careful look at the reporting of marginal results within psychological science.
Reference
Pritschet, L., Powell, D., Horne, Z. (2016). Marginally significant effects as evidence for hypotheses: Changing attitudes over four decades. Psychological Science. doi: http://pss.sagepub.com/content/early/2016/05/14/0956797616645672.abstract


Comments
Yes, the reporting of results as “marginally significant” is deplorable, but the more important issue is that even “significant” p values do NOT tell you what most people think they do–the probability that your results could have occurred by chance, or that they will fail to replicate. See Cohen, J. (1994). The Earth is round (p<.05). American Psychologist 49(12), pp. 997-1003 (Dec. 1994), and Nuzzo, R. (2014). Statistical errors. Nature 506 (13 February 2014), pp. 150-152.
I think in case of marginally significant results it is important to look closely at their interpretation – if these are unexpected/unpredicted results that are not consistent with previous knowledge, they could occur by chance. But if the results were predicted to be significant, or even to be significant but weak, and they are in correspondence with what is already known, than their weight increases, even if p is slightly more than 0.05
I am an independent researcher and have always had a problem with the cut and dry 0.05 = statistically significant. I was bound by that when I did my disertation. BUT I recently conducted a pilot study, mixed method approach and the results showed a consistent emergence of themes, matches with DSM V criteria even to a level considered severe, and the participant life issues almost mimicked the DSM V criteria. When surveyed about quality of life before and after treatment, there was a strong positive correlation coefficient, r=0.85. This means that the data was strongly correlated between the beginning and end of the study in terms of quality of life. Only problem, p=0.11, making it not “statistically significant.” But I do things MY way. Since p= 0.05 means 95% confidence in the results, then 0.11 means 89% confidence in the results. And the statistical significance score means the probability that the correlation is random. So if 0.05 means that there is a 95% chance my correlations aren’t due to chance, that means that 0.11 means there is an 89% chance of my correlations not being due solely to chance. So …. could all these correlations be random? Ok possibly. But likely? No and so it seems to me that the scientific community is asking that we accept chances that are extremely improbable as reasons for invalidating otherwise elucidating studies. I am saying when I publish that my study was significant at the 89% confidence level and a likely indication that the correlations give us the right picture. Say what you want, this is my study and I’ll present it how I want to. Thank you!
Fred – no, that is not what p-values mean. “Since p= 0.05 means 95% confidence in the results”. This is a common misconception of what a p-value is, and I’m surprised this was not pointed out to you by someone while you did your dissertation.
The p-value (in the ideal case) is the likelihood of observing your test statistic or a more extreme one under the null hypothesis. It does not represent a confidence in your results. It represents a strength of evidence against the null hypothesis.
APS regularly opens certain online articles for discussion on our website. Effective February 2021, you must be a logged-in APS member to post comments. By posting a comment, you agree to our Community Guidelines and the display of your profile information, including your name and affiliation. Any opinions, findings, conclusions, or recommendations present in article comments are those of the writers and do not necessarily reflect the views of APS or the article’s author. For more information, please see our Community Guidelines.
Please login with your APS account to comment.