
Practice
TaskMaster: A Tool to Determine When Online Participants Are on Task

Collecting data online has been somewhat common for years now (see Buhrmester et al., 2018; Gosling & Mason, 2015), and constraints on in-person data collection caused by the COVID-19 pandemic have made it an even more common research practice. However, moving from the highly controlled environment of a lab to an online environment where participants cannot be closely monitored may inspire doubts about whether participants are performing experimental tasks as instructed.
Stephanie Permut encourages researchers who are interested in using TaskMaster to visit her GitHub page (steve-permut). She also welcomes emails at [email protected] if you have questions or need assistance with the tool.
Although some researchers have shown that data collected online are frequently of equal or even higher quality than data collected in the lab (e.g., Dodou & de Winter 2014; Gosling et al., 2004), others have raised concerns about the attentiveness, honesty, and experience of online subject pools (e.g., Chandler et al., 2014).
TaskMaster can address some of these concerns. Developed by Stephanie Permut, Matthew Fisher, and APS Fellow Daniel M. Oppenheimer, of Carnegie Mellon University, this free tool helps researchers identify when online participants being tested through Qualtrics—an online survey platform often used for experiments in psychological science—are off task (e.g., using other online apps). In a 2019 tutorial published in Advances in Methods and Practices in Psychological Science, Permut and colleagues detailed several applications of TaskMaster and provided guidelines for its use.
“We developed TaskMaster as a tool to help researchers better account for off-task participant behavior in Qualtrics data,” Permut told the Observer. “The TaskMaster operationalizes off-task behavior as the amount of time that participants spend away from an active Qualtrics survey window. TaskMaster output can be used as a proxy for participant inattention and also as an indicator that participants’ attention is focused where it ought to be” (i.e., that participants are doing tasks as instructed and not making use of outside resources if those resources are prohibited).
A tool to measure on-task time
Participants recruited through Amazon Mechanical Turk (MTurk) report high rates of multitasking while performing experimental tasks, from browsing unrelated web pages to using their phones (Clifford & Jerit, 2014). Multitasking creates the problem of divided attention, which decreases data quality and increases error rates (Borst et al., 2010). TaskMaster uses JavaScript to create variables representing the frequency with which participants enter and leave an active survey window and the length of time they spend both completing the experimental task and remaining within a given window.
TaskMaster is an extension of a validated tool, PageFocus, implemented by Diedenhofen and Musch (2017). It can be easily used within the existing Qualtrics interface, but it goes beyond Qualtrics’s page timer, which allows researchers to monitor the amount of time participants spend on a given page, by also letting researchers track the amount of time participants spend off a given page—even if it remains open.
Loading a page triggers a timer that tracks the amount of time a survey or task window remains in focus. The timer also measures and summarizes time spent with that window open but out of focus (i.e., because of activity on other tabs or applications). TaskMaster thus generates an index of how much time a participant spends on and off task for each page of a survey, creating a compilation of all on- and off-task activity during the survey or experiment.
Participants are unaware of TaskMaster, but it does not invade their privacy because it does not track where they spend off-task time, just how long they stay off task.
Implementing TaskMaster
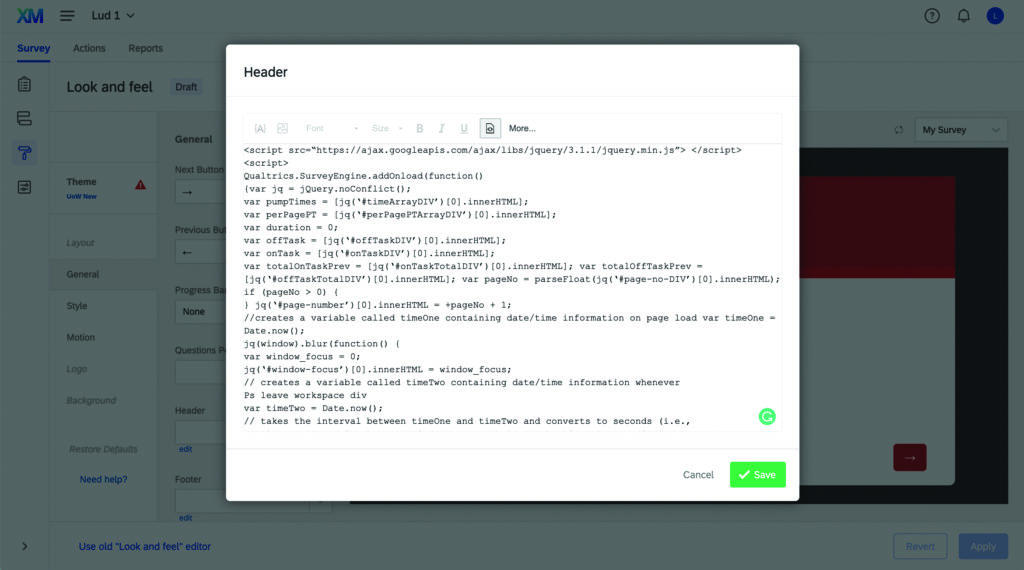
The JavaScript code for TaskMaster is available at github.com/steve-permut/TaskMaster and with this article on the APS website. The code can easily be added to the Qualtrics survey builder.
To add the code, paste github.com/steve-permut/TaskMaster/ blob/master/HeaderCode.html into your Qualtrics survey’s header source HTML, in the General tab of the survey’s Look & Feel menu. When you download the survey data from Qualtrics, time spent on and off task is represented as an array of positive (on-task) and negative (off-task) values.
In addition, TaskMaster’s footer code allows researchers to track navigation data across an entire survey (rather than on one particular page). Paste it into the header source HTML, which is also found in the General tab of the Look & Feel menu.
TaskMaster outputs five variables per monitored page:
- worktimeArray: total time spent both on and off task
- onTask: time spent on task, presented as an array of items representing each time a subject’s cursor entered the work space and the amount of time the subject spent within the task window
- totalOnTask: total time spent completing a task (without subtracting time spent off task)
- offTask: time spent off task, presented as an array of items representing each time the subject’s cursor left the work space and the amount of time the subject spent off task
- totalOffTask: total time spent off task
You must manually add these variables as empty embedded variables in Qualtrics’s Survey Flow. To add empty embedded variables, click on “+Add New Element” and then “Embedded Data.” Next, click on “Create New Field or Choose from Dropdown” and input the first variable name. Then, click on “Add a New Field” below the window and repeat the process for each of the remaining variables. Label the variables exactly as shown. For the script to run properly, disable study transitions (also accessed in a survey’s Look & Feel section). Then export these variables alongside other data in a Qualtrics-generated spreadsheet.
For more information about online research, watch the APS webinar Online Research: Tools and Techniques.
This tool splits the single column of arrays outputted by Qualtrics into a set of per-page variables. Each row in the spreadsheet represents a single participant’s data, and there are four columns for each page of the survey:
- Page_N: on- and off-task behavior at the page level, with negative numbers indicating the duration of intervals with the cursor outside the task window and positive numbers indicating the duration of intervals with the cursor inside the task window
- Page_N_ClickAways: number of times the subject clicked away from the page (corresponding to the count of negative values in the Page_N array)
- Page_N_TimeOffPage: total amount of time spent off a given page (the absolute value of the sum of the negative values in the Page_N array)
- Page_N_TimeOnPage: total amount of time spent on a given page (the sum of the positive values in the Page_N array)
Feedback on this article? Email [email protected] or scroll down to comment.
References
Borst, J. P., Taatgen, N. A., & Van Rijn, H. (2010). The problem state: a cognitive bottleneck in multitasking. Journal of Experimental Psychology: Learning, memory, and cognition, 36(2), 363. https://doi.org/10.1037/a0018106
Buhrmester, M. D., Talaifar, S., & Gosling, S. D. (2018). An evaluation of Amazon’s Mechanical Turk, its rapid rise, and its effective use. Perspectives on Psychological Science, 13(2), 149–154. https://doi.org/10.1177/1745691617706516
Chandler, J., Mueller, P., & Paolacci, G. (2014). Nonnaïveté among Amazon Mechanical Turk workers: Consequences and solutions for behavioral researchers. Behavior Research Methods, 46(1), 112–130. https://doi.org/10.3758/s13428-013-0365-7
Clifford, S., & Jerit, J. (2014). Is there a cost to convenience? An experimental comparison of data quality in laboratory and online studies. Journal of Experimental Political Science, 1(2), 120-131. https://doi.org/10.1017/xps.2014.5
Diedenhofen, B., & Musch, J. (2017). PageFocus: Using paradata to detect and prevent cheating on online achievement tests. Behavior Research Methods, 49(4), 1444–1459. https://doi.org/10.3758/s13428-016-0800-7
Dodou, D., & de Winter, J. C. (2014). Social desirability is the same in offline, online, and paper surveys: A meta-analysis. Computers in Human Behavior, 36, 487-495. https://doi.org/10.1016/j.chb.2014.04.005
Gosling, S. D., & Mason, W. (2015). Internet research in psychology. Annual Review of Psychology, 66(1), 877–902. https://doi.org/10.1146/annurev-psych-010814-015321
Gosling, S. D., Vazire, S., Srivastava, S., & John, O. P. (2004). Should we trust web-based studies? A comparative analysis of six preconceptions about internet questionnaires. American Psychologist, 59(2), 93–104. https://doi.org/10.1037/0003-066X.59.2.93
Permut, S., Fisher, M., & Oppenheimer, D. M. (2019). TaskMaster: A tool for determining when subjects are on task. Advances in Methods and Practices in Psychological Science, 2(2), 188–196. https://doi.org/10.1177/2515245919838479


APS regularly opens certain online articles for discussion on our website. Effective February 2021, you must be a logged-in APS member to post comments. By posting a comment, you agree to our Community Guidelines and the display of your profile information, including your name and affiliation. Any opinions, findings, conclusions, or recommendations present in article comments are those of the writers and do not necessarily reflect the views of APS or the article’s author. For more information, please see our Community Guidelines.
Please login with your APS account to comment.