
Featured
Millions of Findings at Your Fingertips
Supplementing the Traditional Literature-Search Process with metaBUS
The field of psychology has produced hundreds of thousands of journal articles and, within them, millions of findings in the form of effect sizes (e.g., correlation coefficients). As researchers, we rely on these findings practically every day—to estimate statistical power, generate or justify research questions, conduct meta-analyses, interpret research outcomes, satisfy simple curiosities, and, for some, to joke with colleagues about the conventions of null-hypothesis significance testing. After all, as noted by Cohen (1988), the effect size is “what science is all about” (p. 532). So, in an age in which most of us are accustomed to Amazon.com, why do we still search for research findings the old-fashioned way? Why don’t we have a search engine of our research findings?
Most psychologists are familiar with the traditional, “top-down” literature search process. It starts by specifying a phenomenon of interest and ends after arduous hours of searching and filtering. Although impressive in scope, search engines like Google Scholar operate at a higher order (i.e., article) level and, consequently, often return too few hits and too many misses. This can make the search process a monument of inefficiency.
But what if things were different? What if the millions of psychology findings were managed with Amazon.com-like efficiency? Imagine if a researcher could visit a website, request all reported findings on the relation between, say, conscientiousness and age, and then view an instant meta-analysis containing hundreds of previously published findings. In fact, this functionality has been around for several years in the domain of applied psychology through the metaBUS platform (Bosco, Aguinis, Singh, Field, & Pierce, 2015; Bosco, Field, Larsen, Chang, & Uggerslev, 2020).
The metaBUS approach is, essentially, the opposite of the current search process. That is, the platform systematically extracts all findings from papers and then allows users to specify phenomena of interest to retrieve and summarize findings. One clear benefit of the metaBUS approach is portability: The effort involved in extraction can be leveraged to facilitate research in perpetuity, even long after achieving your presumed end goal, such as publication.
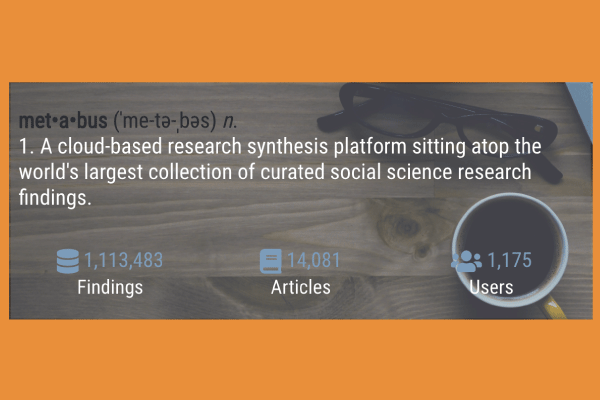
With more than 1,100,000 findings and growing, metaBUS is, to our knowledge, the largest manually curated collection of research findings across the social sciences.
The Backstory
As a doctoral student, I worked with faculty who were enthusiastic about content-analysis and meta-analysis in the organizational sciences (e.g., Aguinis, Dalton, Bosco, Pierce, & Dalton, 2011; Dalton, Aguinis, Dalton, Bosco, & Pierce, 2012). I began to convince myself that if allprimary studies’ research findings were in one big database, conducting and updating meta-analyses would be a breeze. Furthermore, many “science of science” questions could be addressed. Why hadn’t we developed such a database? Probably because the task was perceived as overwhelming. In fact, I was repeatedly advised by colleagues to “earn tenure before launching a crazy project like that!”
But I couldn’t help myself. I was a huge Microsoft Excel enthusiast (still am). And, luckily, I worked in a field in which effect sizes were, in more than 90% of cases, correlations reported within nice, neat matrices. There’s a lot of data in those matrices—zero-order effects ripe for meta-analyzing. In 2011, to take my mind off my dissertation, I started experimenting with combinations of PDF extraction software and Visual Basic for Applications (VBA) script in Excel (the script was needed to transpose the extracted data, remove non-numeric characters, and the like). Eventually, I had the semiautomated extraction process down to roughly 15 to 30 seconds per matrix.
The next hurdle was the “vocabulary problem”; that is, many terms refer to the same thing (Furnas, Landauer, Gomez, & Dumais, 1987). After collecting a few thousand rows of data, it became clear that the variety of terms was debilitating. I couldn’t just search for “performance” (a common applied-psychology topic) and expect to locate results comprehensively. I was going to need a hierarchical taxonomy containing essentially all things studied in the scientific space, with each entry tagged to the taxonomy. Between 2011 and 2013, I collaborated with Kulraj Singh and James Field to develop a taxonomy containing roughly 5,000 variables/constructs. We also refined protocols for semiautomated correlation-matrix extraction and manual coding. Together, by 2013, we had amassed a database of roughly 200,000 findings and had started answering “big science” questions with it (see Bosco et al., 2015). All the original components remain in use by metaBUS today.
Over time, with funding assistance and new team members, the database grew and evolved. We also experimented with a variety of web-based software platforms before ultimately deciding on a platform built in R Shiny (Chang, Cheng, Allaire, Xie, & McPherson, 2019). Today, the metaBUS platform is used regularly in the field of applied psychology to conduct and assist meta-analyses.
metaBUS: Under the Hood
The process of extracting and classifying findings with metaBUS begins with the semiautomated extraction of correlation matrix content using optical-character-recognition software. The extraction is considered semiautomated because trained coders oversee the process for each matrix to ensure accurate transcription into a standardized database format.
Next, for each variable contained in each matrix, trained coders manually assign classifications pertaining to several attributes (e.g., country of origin, sample size, sample type, response rate). They also manually classify each variable according to the metaBUS taxonomy, a hierarchical “map” of nearly 5,000 constructs and variables studied in applied psychology. MetaBUS also leverages R software packages to analyze search results, thus enabling instant, rudimentary meta-analyses.
Test-Drive Demonstrations
Following are easy-to-replicate functionality demonstrations geared toward the first-time user—a sort of metaBUS test drive. I demonstrate the metaBUS taxonomy and the process of conducting an instant meta-analysis. I also describe how one might leverage each deliverable to enhance research and graduate training.
Please keep in mind that the metaBUS platform currently contains findings from appliedpsychology (i.e., industrial-organizational psychology and related fields such as human-resource management and organizational behavior) simply because that’s where the project began. There is the potential to expand metaBUS to other areas of psychology, but a search at this time for terms such as “Stroop effect” or “word frequency” or “implicit attitudes toward sugared soft drinks” is likely to be disappointing.
Demonstration 1: Explore the Taxonomy
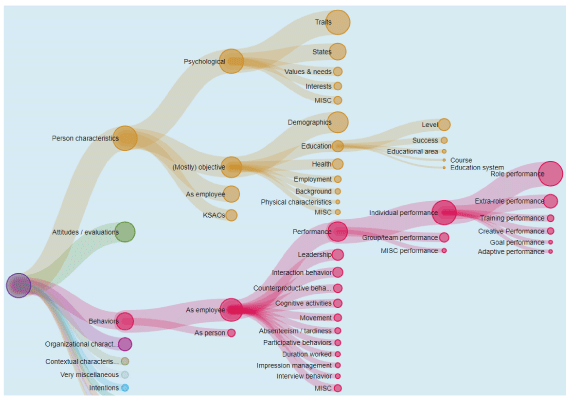
As a starting point for gaining familiarity with metaBUS, I suggest exploring the taxonomy of constructs. The taxonomy is arranged hierarchically and contains nearly 5,000 construct or variable names that appear in applied psychology. As shown in the figure on the opposite page, the taxonomy starts with broad branches (e.g., behaviors, attitudes), each of which subsumes finer level topics. For instance, behaviors subsumes employee performance and absenteeism. During data collection, coders manually assign all reported variables a taxonomic node (represented by a five-digit unique identifier), providing some degree of shelter from the vocabulary problem.
Research use cases: Researchers can explore the taxonomy to browse and ascertain the variety of terms used to refer to a given construct. As an example from applied psychology, the following terms that have appeared in published sources are equivalent: turnover intention, quit intention, conviction of decision to quit, considering exit, perceived chance of leaving. Thus, for a traditional literature search, such terms could be added to other to-be-searched variants. Alternatively, to conduct a metaBUS literature search independent of text-string shortcomings, one could rely on taxonomy codes in addition to—or instead of—text strings. For example, rather than dealing with the variety of terms used to refer to turnover intention, you could simply specify 20179 (i.e., an arbitrary 5-digit code representing quit intentions in the metaBUS taxonomy), which will capture all entries tagged by coders as 20179 during data collection, as well as all the node’s “children.”
Education use cases: Students can interact with the taxonomy to gain a rapid awareness of the universe of constructs studied within an entire scientific space along with an understanding of constructs’ conceptual neighbors. Furthermore, because the node size is scaled according to the construct’s frequency of occurrence in tables of results (larger nodes are studied more frequently), students can quickly gain an understanding of variance in research attention across topics, indicating, for example, areas ripe for meta-analysis.
My colleagues and I urge readers to browse the metaBUS taxonomy and then, as a thought experiment, consider a scientific field with which they have little familiarity. In my case, such a field is sociology. I asked myself, What would an analogous map of sociology look like? I have no idea, but I can imagine the enormous educational value of a “map” of sociology topics, arranged by frequency, especially if I were a student of sociology.
Demonstration 2: Conduct an Instant Meta-Analysis
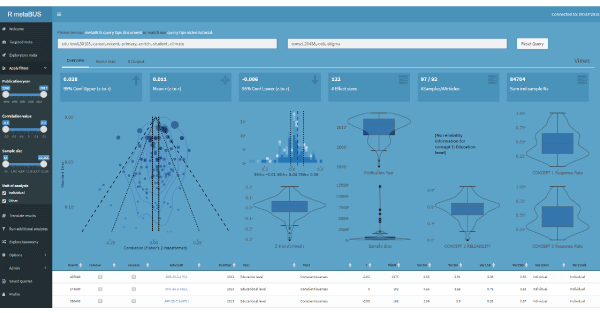
When presenting metaBUS at conferences, I often demonstrate the instant meta-analysis feature by asking the audience to name two constructs. (It feels a bit like performing a magic trick: “Pick a construct, any construct.”) On one occasion, the audience picked turnover intention and self-efficacy. I submitted the two constructs to a metaBUS search and, abracadabra, within a few seconds, I presented the results of an instant, rudimentary meta-analysis that returned 49 effects with a mean r of –.06. Try the same analysis by duplicating the search terms shown in the figure on this page on the metaBUS platform (shiny.metaBUS.org).
To conduct an instant meta-analysis, two search terms must be specified in the form of taxonomic codes, text strings, or a combination of the two. (See Bosco et al., 2020 for new “exploratory” meta-analysis search functionality that requires specifying only one search term.) Because the taxonomy contains roughly 5,000 elements, the number of possible taxonomic search-term permutations is quite large. However, many possible pairs return zero results; thus, we urge users to try the platform at first by considering searches that involve popular research topics. (As noted earlier, construct frequency may be ascertained by contrasting the metaBUS taxonomy’s node sizes.)
Research use cases: The most obvious use case of the metaBUS instant meta-analysis feature is to facilitate the location of research findings. Indeed, findings are often difficult to locate because their variables may have played an ancillary role in the study (e.g., age as a control variable) and are not visible in the article’s abstract or keywords. Thus, researchers conducting meta-analyses may wish to search metaBUS to locate findings that may have gone overlooked following a traditional literature search. Furthermore, authors frequently require examples of previous findings to craft manuscript introductions or to justify hypothesis statements. In situations like these, a search engine of findings such as metaBUS becomes highly useful.
Additionally, we envision a variety of meta-scientific studies using the metaBUS database. For example, studies that have examined the frequency distribution of p values (i.e., p-curves) have lamented existing reporting conventions (e.g., p < .05) that prevent the calculation of exact p values. In contrast, the metaBUS database contains more than 1,000,000 findings, each with a corresponding sample size. This would allow the largest investigation on the p-curve, with available nuance by publication year and bivariate relation type, and the analyses could likely be completed in a single day! Again, the up-front effort associated with the extraction of findings is portable to other purposes.
Education use cases: Meta-analyses have increased in popularity over the last several decades. In fact, many graduate degree programs now include meta-analysis training. The metaBUS instant meta-analysis feature could be an ideal teaching tool for these courses. Indeed, using the platform, users can interact with the contributing effects (i.e., toggle include/exclude and view impact on summaries), limit by sample size, publication year, and the like. Furthermore, students could gain familiarity with scripting languages by viewing the R script used to derive the meta-analytic estimate.
A Well-Funded, Collaborative Future
At this point, one might wonder, “can metaBUS be adapted to psychology more broadly—beyond applied psychology?” My knee-jerk response is, “yes, with sufficient elbow grease and collaboration.”
As my colleagues and I describe in AMPPS (2020), the contents of correlation matrices are easy to extract and contain a wealth of information. However, effect-size reporting in other areas (e.g., much of experimental psychology) is precisely the opposite—the articles often contain relatively few effects, and the sheer variety of effect-size indices (and conditions that give rise to them) makes challenging the development and navigation of coding protocols. Put differently, efficient coding of experimental research is possible, but it will require some serious head-scratching. However, there are certainly other areas of psychology (e.g., military, personality, developmental, educational) that have traditionally reported correlation matrices or, over time, have done so with increased frequency. In my view, the best chance psychology has to demonstrate and promote effective, accurate curation of the research backlog in the near term, is to (a) focus on areas that have reported correlations by convention (i.e., worry about experimental research later on), (b) secure long-term funding for manual curation, and (c) assume a collaborative mindset.
I will elaborate.
Regarding funding, I love a magic pill as much as the next person. However, I believe it is unwise, at this time, to sink millions of dollars into unattended algorithm-based/artificial intelligence approaches with hopes of achieving a one-click solution to curating psychological research. In my view, it would be far wiser to fund manual effort-driven curation at first, for these reasons:
It would cost less to pay graduate students (e.g., during the summer) to manually code—or perhaps double-code—the backlog.
This effort would result in a more reliable database (compared with automated approaches), and its contents would be immediately useful for a variety of scientific purposes.
The data created from manual efforts would serve as the ideal “answer key” for later development of automated solutions.
Viewed through this lens, it would seem funders and researchers often put the cart before the horse and waste resources. So, for the near term, and to put it frankly, perhaps we should leave the engineering work to engineers and the psychology work to psychologists—at least until our data warehouse is in order. Regardless, dedicated, long-term funding should flow directly from psychology’s known stakeholders to develop and maintain these manually curated search engines. To prioritize the curation and indexing of one’s corpus of findings is, in my opinion, a no-brainer.
Regarding collaborative mindsets, let me first note that competition is not necessarily an unhealthy thing. Indeed, academics regularly compete for limited journal space and research funding; we are not strangers to the recognition economy and relish being the “first,” the “founder,” the “lead,” the “principal investigator,” and the like. However, some efforts, such as those involved in curating an entire scientific field’s findings, rely on coordinated efforts (e.g., Collins, Morgan, & Patrinos, 2003). Fewer resources would be wasted by coordinated effort than a dozen ego-driven teams hoping to secure their respective places as top gun. This would only lead to delayed progress or, worse, incompatible database formats that limit the ability to merge data and answer larger questions.
I am optimistic that the metaBUS approach (by any other name) will spread throughout psychology and beyond. Indeed, research findings are important, and it’s unwise to bet against the value provided by search engines. I just hope that it will be done collaboratively so that efficiency and scientific insight might prevail, and so that scientists—for the near-term, at least—resist the urge to develop “magic pills.” This is a job that, at the present time, requires elbow grease for proper completion.
metaBUS at a Glance
• MetaBUS is a cloud-based research-synthesis platform sitting atop the world’s largest collection of curated social-science research
findings.
• More than 1,113,000 findings from more than 14,000 published articles
• More than 1,175 users (faculty, students, and practitioners) who have together conducted roughly 13,000 searches
• Funding sources: None until 2014; later sources include the National Science Foundation and the Social Sciences Humanities Research Council
• 44 team members (listed at metabus.org/about_us/)
• Learn more at metabus.org, or explore the platform, including an interactive version of the taxonomy, at shiny.metabus.org. For a more detailed look at metaBUS, also see Bosco et al. (2020).
References
Bosco, F. A., Aguinis, H., Singh, K., Field, J. G., & Pierce, C. A. (2015). Correlational effect size benchmarks. Journal of Applied Psychology, 100, 431–449.
Bosco, F. A., Field, J. G., Larsen, K., Chang, Y., & Uggerslev, K. L. (2020). Advancing meta-analysis with knowledge management platforms: Using metaBUS in psychology. Advances in Methods and Practices in Psychological Science. Advance online publication. doi:10.1177/2515245919882693
Chang, W., Cheng, J., Allaire, J., Xie, Y., & McPherson, J. (2019). shiny: Web application framework for R (Version 1.3.2) [Software]. Retrieved from http://cran.r-project.org/web/packages/shiny
Cohen, J. (1988). Statistical power analysis for the behavioral sciences (2nd ed.). Hillsdale, NJ: Erlbaum.
Collins, F. S., Morgan, M., & Patrinos, A. (2003). The Human Genome Project: Lessons from large-scale biology. Science, 300(5617), 286–290.
Furnas, G. W., Landauer, T. K., Gomez, L. M., & Dumais, S. T. (1987). The vocabulary problem in human-system communication. Communications of the ACM, 30, 964–971.
Neppali, K., Caragea, C., Mayes, R., Nimon, K., & Oswald, F. (2016). MetaSeer.STEM: Towards automating meta-analyses. In D. Schuurmans & M. Wellman (Eds.), Proceedings of the Thirtieth AAAI Conference on Artificial Intelligence and the Twenty-Eighth Innovative Applications of Artificial Intelligence Conference (Vol. 5,pp. 4035-4040). Palo Alto, CA: Association for the Advancement of Artificial Intelligence.


APS regularly opens certain online articles for discussion on our website. Effective February 2021, you must be a logged-in APS member to post comments. By posting a comment, you agree to our Community Guidelines and the display of your profile information, including your name and affiliation. Any opinions, findings, conclusions, or recommendations present in article comments are those of the writers and do not necessarily reflect the views of APS or the article’s author. For more information, please see our Community Guidelines.
Please login with your APS account to comment.