
Teaching Current Directions in Psychological Science
Aimed at integrating cutting-edge psychological science into the classroom, Teaching Current Directions in Psychological Science offers advice and how-to guidance about teaching a particular area of research or topic in psychological science that has been the focus of an article in the APS journal Current Directions in Psychological Science. Current Directions is a peer-reviewed bimonthly journal featuring reviews by leading experts covering all of scientific psychology and its applications and allowing readers to stay apprised of important developments across subfields beyond their areas of expertise. Its articles are written to be accessible to nonexperts, making them ideally suited for use in the classroom.
Visit the column for supplementary components, including classroom activities and demonstrations.
Visit David G. Myers at his blog “Talk Psych”. Similar to the APS Observer column, the mission of his blog is to provide weekly updates on psychological science. Myers and DeWall also coauthor a suite of introductory psychology textbooks, including Psychology (11th Ed.), Exploring Psychology (10th Ed.), and Psychology in Everyday Life (4th Ed.).
When More Isn’t Better: The Costs of Extreme Personalities
The Gaps Among Us: Understanding and Assessing Inequality
When More Isn’t Better: The Costs of Extreme Personalities
By C. Nathan DeWall
Carter, N. T., Miller, J. D., & Widiger, T. A. (2018). Extreme personalities at work and in life. Current Directions in Psychological Science. Advance online publication.
Extreme personalities rivet our attention. People are talkative or timid, friendly or ferocious, dependable or dodgy, tense or tepid, and open to new experiences or opting for the status quo. Yet it remains unclear whether extreme personality traits help or hinder your work and life. According to Nathan Carter, Joshua Miller, and Thomas Widiger (2018), moderation helps.
The authors argue that common approaches to the study of personality assume that extremely high levels of a trait indicate that it is adaptive. But sometimes extremity is counterproductive. Agreeable people are often helpful, whereas disagreeable people often experience ostracism (Hales, Williams, Kassner, & Graziano, 2016). Taken to extremes, however, agreeable people can be so nice that they suffer in silence or avoid having productive arguments.
Why does personality research ignore the potential downsides of extremely high levels of personality traits? Carter and colleagues pinpoint two reasons. First, researchers often sum participants’ scores rather than using item response theory (IRT) — an advanced technique that identifies ideal points in scoring to let researchers know whether participants’ responses are above or below what one might expect from someone answering the question. Second, personality psychologists simply haven’t yet theorized about the benefits and costs of extremely high levels of personality traits.
To bring this cutting-edge research into the classroom, instructors can ask students to complete one or two personality questionnaires. The activities might work well when teaching trait theory to Introduction to Psychology or Personality Psychology courses. These activities will also show students how to score personality questionnaires — a useful skill that will pay off if they take more advanced psychology courses.
For each activity, show students the following instructions (from Soto & John, 2017):
Here are a number of characteristics that may or may not apply to you. For example, do you agree that you are someone who likes to spend time with others? Please write a number next to each statement to indicate the extent to which you agree or disagree with that statement (1 = Disagree strongly; 2 = Disagree a little; 3 = Neutral, no opinion; 4 = Agree a little; 5 = Agree strongly).
Activity #1: Conscientiousness
_____ Tends to be disorganized.
_____ Tends to be lazy.
_____ Is dependable, steady.
_____ Is systematic, likes to keep things in order.
_____ Has difficulty getting started on tasks.
_____ Can be somewhat careless.
_____ Keeps things neat and tidy.
_____ Is efficient, gets things done.
_____ Is reliable, can always be counted on.
_____ Leaves a mess, doesn’t clean up.
_____ Is persistent, works until the task is finished.
_____ Sometimes behaves irresponsibly.
After students respond to the conscientiousness questions, have them score their responses. First, they’ll need to reverse-score the following questions: 3, 4, 5, 8, 9, 10. For an easy shortcut, students can subtract their responses from the number 6 (e.g., a response of 2 would be reverse-scored to 6 – 2 = 4). Next, ask students to average all of their responses to compute their overall conscientiousness score (responses / 12). Finally, share with students the average student conscientiousness score (3.44; men: 3.34, women: 3.54).
With a partner, students can discuss their conscientiousness scores. Were they higher, lower, or about the same as the average student score? How might extremely high levels of conscientiousness cause people problems in their work lives or personal relationships? What about how extremely low levels of conscientiousness might predict difficulties at work and at home? In what work and personal situations might moderate amounts of conscientious pay off?
Instructors can then review Carter and colleagues’ arguments regarding the potential downsides of extremely high and low levels of agreeableness. At extremely high levels of conscientiousness, people can become preoccupied with orderliness and making sure that they have complete control over their minds and social environments (Lynam & Widiger, 2001). Highly conscientiousness people can also struggle when they receive negative job feedback performance (Cianci, Klein, & Seijts, 2010). Extremely low levels of conscientiousness can also plague work and health outcomes, such as failing to meet
deadlines or getting adequate exercise (Barrick & Mount, 1991; Bogg & Roberts, 2004). Moderate conscientiousness and self-efficacy, however, bode well for school performance and emotional well-being (Carter et al., 2016; 2018).
Activity #2: Extraversion
_____ Is outgoing, sociable.
_____ Has an assertive personality.
_____ Rarely feels excited or eager.=
_____ Tends to be quiet.
_____ Is dominant, acts as a leader.
_____ Is less active than other people.
_____ Is sometimes shy, introverted.
_____ Finds it hard to influence people.
_____ Is full of energy.
_____ Is talkative.
_____Prefers to have others take charge.
_____Shows a lot of enthusiasm.
Similar to Activity #1, ask students to score their responses to the extraversion items. They will need to reverse-score the following questions: 3, 4, 6, 7, 8, 11. Students can use the same reverse-score shortcut by subtracting their responses from the number 6 (e.g., a response of 4 would be reverse-scored to 6 – 4 = 2). To compute their overall extraversion score, students will average their responses (responses / 12). Finally, let students compare their score to an average student’s extraversion score (3.25; Men: 3.20, Women: 3.31).
Students can again discuss their scores with a partner and brainstorm the boons and banes of extreme extraversion. Have they known people with extremely high or low extraversion? What benefits and costs did those people experience?
Carter and colleagues (2018) describe several findings that question the upsides of extremely high levels of extraversion. Taken to extremes, gregariousness can border on an obsessive need for attention and sexual promiscuity (Wilt & Revelle, 2017). The fearless dominance/boldness component of extraversion — what might get you into the boardroom or the Oval Office — is also a feature of psychopathy (Lilienfeld et al., 2012; Patrick, Krueger, & Fowles, 2009). At extremely low levels of extraversion, people can struggle with anxiety and depression (Jylhä & Isometsä, 2006; Spinhova, 2014). Who tends to show good sales performance, prosocial behavior at work, and safe behavior? People with moderate levels of extraversion (Grant, 2013; Williamson & Carter, 2016; Yuen et al., 2018).
Extreme personalities make headlines, but that doesn’t mean having one will always improve your work and life. Sometimes moderation is the way to go.
BFI-2 items copyright 2015 by Oliver P. John and Christopher J. Soto. Reprinted with permission. For more information about the BFI-2, visit the Colby Personality Lab website at http://www.colby.edu/psych/personality-lab/.
The Gaps Among Us: Understanding and Assessing Inequality
By David G. Myers
Consider three facts about today’s income inequality:
Inequality has sharply increased. The rising economic tide is lifting the yachts faster than the dinghies — especially in India, China, Russia, and the United States (see Figure 1; World Inequality Lab, 2018).
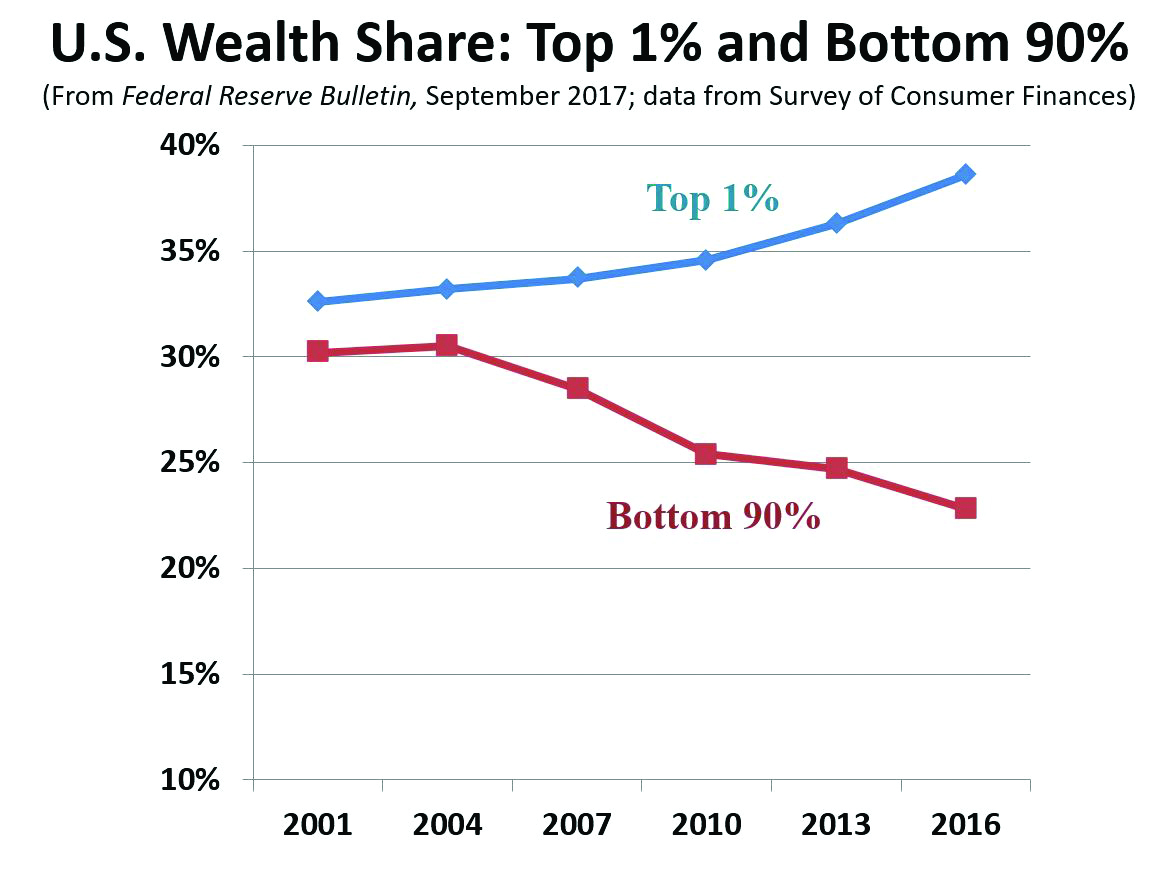
Figure 1
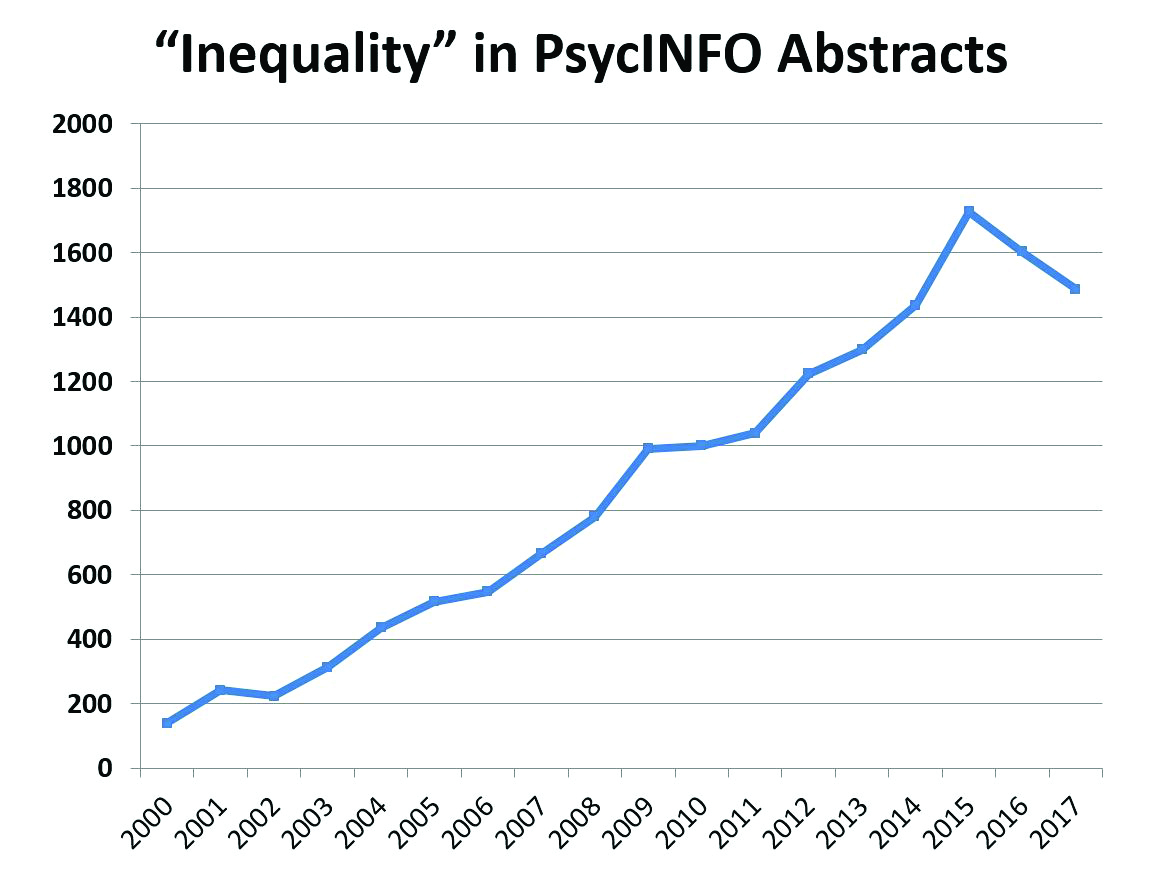
Figure 2
In response, psychological scientists are now studying the accompaniments and public understandings of inequality (see Figure 2). One of their findings:
Unequal places tend to be unhappy places. Countries and states with greater inequality tend also to have more unhealthiness, social problems, dissatisfaction with life, and mental disorders (Burkhauser, De Neve, & Powdthavee, 2016; Payne, 2017; Wilkinson & Pickett, 2017a,b). Where there is less inequality, humans more often flourish.
As a standout example of the new inequality research, consider surveys by Michael Norton, William Arsenio, and others of how much inequality people perceive and how much inequality they would ideally prefer.
The survey questions asked of adults and adolescents in the United States and elsewhere could be simplified for your students:
“Make a guess: In your country, what percent of the wealth is owned by the top 20%?”
“Ideally, what percent of the wealth should be owned by the top 20%?”
Arsenio (2018; and Norton & Ariely, 2011) report that, across variations in question wording, people recognize that inequality exists. In the United States, for example, adolescents have estimated that the top 20% own 48% of the wealth, while adults have guessed 59%. But both greatly underestimate the actual wealth inequality (with 84% owned by the top 20% and 0.1% by the bottom 20% — an 840:1 disparity that is 42 times greater than adults guessed).
A second finding, notes Arsenio, is that (my italics) “people prefer a more egalitarian wealth distribution than the one they believe exists.”
Moreover — and more surprisingly — Republicans (or “conservatives”) and Democrats (or “liberals”) offer similar estimates of actual and ideal wealth distributions. Across political persuasions, most Americans favor the richest 20% owning about 30% to 40% of the wealth — which is much closer to the reality in Sweden than in the United States. Worldwide, people also would prefer much smaller pay gaps between corporate CEOs and their workers. As Sorapop Kiatpongsan and Norton (2014) summarize, “People all over the world and from all walks of life would prefer smaller pay gaps between the rich and poor.”
Are these findings true for your students as well? Do they, too, underestimate wealth inequality? And do they — whether describing themselves as more Republican/conservative or as more Democrat/liberal — prefer a more egalitarian wealth distribution than what they think exists (much less than what actually exists)?
A final note: Might teaching about the realities and perceptions of inequality expose us teachers to accusations of “liberal bias”? If so, there are two possible responses:
The psychology of inequality does not dictate economic policy.
One could argue, as do progressives, that income redistribution, an increased minimum wage, and inequality-reducing tax policies would entail psychological and social benefits. (Think Sweden.)
Or one could argue, as do conservatives, that inequality is inevitable (attributable to variations in competence and effort), and that free-market incentives that inspire some to attain wealth also promote innovation and economic growth.
Students could also be encouraged to ponder: What extent of inequality would optimally enable both human flourishing and economic growth? And how might society balance the benefits of free-market incentives with exacerbating the social costs of inequality?
Beyond this lesson, psychology’s data sometimes support liberal thinking (about, say, the realities of sexual orientation or the pervasiveness of prejudice) and sometimes support conservative thinking (about, say, the benefits of marriage and coparenting or the effects of teen exposure to pornography). As a science, psychology aims not to advance liberal or conservative thinking per se, but to let evidence inform our thinking. And for us teachers of psychology that, no matter our political identities, is perhaps the biggest lesson of all.
References
Barrick, M. R., & Mount, M. K. (1991). The big five personality dimensions and job performance: A meta-analysis. Personnel Psychology, 44, 1-26.
Bogg, T., & Roberts, B. W. (2004). Conscientiousness and health-related behaviors: A meta-analysis of the leading behavioral contributors to mortality. Psychological Bulletin, 130, 887-919.
Burkhauser, R. V., De Neve, J-E., & Powdthavee, N. (2016, January). Top incomes and human well-being around the world. Discussion paper 9677. IZA, Bonn, Germany (ftp.iza.org/dp9677.pdf).
Grant, A.M. (2013). Rethinking the extraverted sales ideal: The ambivert advantage. Psychological Science, 24, 1024-1030.
Graziano, W. G., Habashi, M. M., Sheese, B. E., Tobin, R. M. (2007). Agreeableness, empathy, and helping: A person x situation perspective. Journal of Personality and Social Psychology, 93, 583-599.
Hales, A., Williams, K., Kassner, M., & Graziano, W. G. (2016). Disagreeableness as a cause and consequence of ostracism. Personality & Social Psychology Bulletin, 42, 782-797.
Jylhä, P., & Isometsä, E. (2006). The relationships of neuroticism and extraversion to symptoms of anxiety and depression in the general population. Depression & Anxiety, 23, 281-289.
Kiatpongsan, S., & Norton, M. (2014). How much (more) should CEOs make? A universal desire for more equal pay. Perspectives on Psychological Science, 9, 587–593.
Lilienfeld, S. O., Waldman, I. D., Landfield, K., Watts, A. L., Rubenzer, S., & Faschingbauer, T. R. (2012). Fearless dominance and the U.S. presidency: implications of psychopathic personality traits for successful and unsuccessful political leadership. Journal of Personality and Social Psychology, 103, 489-505. doi: 10.1037/a0029392.
Norton, M. I., & Ariely, D. (2011). Building a better America—one wealth quintile at a time. Perspectives on Psychological Science, 6, 9–12.
Patrick, C. J., Fowles, D. C., & Krueger, R. F. (2009). Triarchic conceptualization of psychopathy: Developmental origins of disinhibition, boldness, and meanness. Development and psychopathology, 21, 913-938.
Payne, B. K. (2017). The broken ladder: How inequality affects the way we think, live, and die. New York: Viking.
Spinhova, P., Elzinga, B. M., van Hemert, A. M., de Rooij, M., & Penninx, B. W. (2014). A longitudinal study of facets of extraversion in depression and social anxiety. Personality and Individual Differences, 71, 39-44.
Soto, C. J., & John, O. P. (2017). The next Big Five Inventory (BFI-2): Developing and assessing a hierarchical model with 15 facets to enhance bandwidth, fidelity, and predictive power. Journal of Personality and Social Psychology, 113, 117–143.
Wilkinson, R. G., & Pickett, K. E. (2017a). The enemy between us: The psychological and social costs of inequality. European Journal of Social Psychology, 47, 11–24.
Wilkinson, R., & Pickett, K. (2017b). Inequality and mental illness. The Lancet Psychiatry, 4, 512–513.
Williamson, R.L., & Carter, N.T. (April, 2016). The development of an ideal point measure of extraversion facets. In N. T. Carter, R. L. Williamson, and R. T. King (Chairs), Exciting new adventures in Thurstonian measurement for self-report data. Symposium presented at the 2016 Meeting of the Society for Industrial and Organizational Psychology: Anaheim, CA.
World Inequality Lab. (2018). World inequality report 2018: Executive summary. World Inequality Database (WIR2018.WID.World).
Yuan, X., Li, Y., Xu, Y., Huang, N. (2018). Curvilinear effects of personality on safety performance: The moderating role of supervisor support. Personality and Individual Differences, 122, 55–61.


APS regularly opens certain online articles for discussion on our website. Effective February 2021, you must be a logged-in APS member to post comments. By posting a comment, you agree to our Community Guidelines and the display of your profile information, including your name and affiliation. Any opinions, findings, conclusions, or recommendations present in article comments are those of the writers and do not necessarily reflect the views of APS or the article’s author. For more information, please see our Community Guidelines.
Please login with your APS account to comment.