
Data on Display
In line with our field’s goals of improving openness, methodological rigor, and reproducibility of science, graphical descriptives (GDs) — the visualization of research data — can be used in the research process and eventually be developed into a routine component of the publication process. GDs can serve as quick and efficient checks for authors, reviewers, and the general scientific audience to assess data distributions, variable relations, outliers, and the appropriateness of statistical analyses while maintaining a level of information privacy and security.
In order to promote scientific reproducibility, GDs provide as much information about the data as possible while balancing visual efficacy (e.g., reducing clutter) and the potential need for data privacy so that proprietary data sets cannot be recreated from the visual presentation. They provide efficient, visual checks of data-analytic assumptions and inferences. And they can be conveniently applied and reported to a wide array of data with minimal burden on researchers, reviewers, editors, or publishers.
One way to promote high standards in our science is by publicly disclosing all data. Yet such a tactic has limits, such as the time costs for reviewers and/or the additional financial costs for statisticians to analyze the data. In addition, some areas of psychological science (e.g., industrial/organizational, educational, and health) often rely on proprietary data that cannot be easily shared. Finally, researchers who spend substantial amounts of time, energy, and money collecting data, only to be required to share those data with researchers who have not invested as heavily in the data collection process, may find opening access to their data to be reciprocally unfair.
Given these practical restrictions, suggested alternatives to the public disclosure of data include encouraging researchers to submit the datasets used in their analyses to the journal when they submit their manuscripts for peer review or, similarly, to submit the materials used for their procedures. Researchers are also encouraged to preregister their designs and analytic plans and to utilize the new statistics reporting methods that focus on estimation of effect sizes, confidence intervals, and meta-analyses (e.g., Cumming, 2014; Funder et al., 2014; Nosek & Lakens, 2014).
The proposed GDs approach complements these other approaches by utilizing the strengths of data visualizations to convey rich, nuanced information not easily gleaned by more traditional methods of data reporting (e.g., correlations, means, variances). GDs potentially provide unique insights into fundamental data issues including assessing basic data distributions, (non)linearity between variables, outliers, patterns of missing data, and the tenability of assumptions underlying various statistical analyses. Although such topics are regularly covered in courses on psychological methods and statistics, it is less common to see such topics explicated in our research.
Part of the reason for the lack of reporting of data checks may stem from journal space limitations. However, the growing acceptance of online supplemental material can provide the necessary space for its inclusion. Moreover, the proliferation and availability of new data visualization tools, in traditional statistical software as well as those offered in the free software R, allow convenient data visualizations that are generalizable for a variety of data types and analyses (Chang, 2013; Murrell, 2011). GDs can provide information about univariate and bivariate data distributions, which may improve our understanding of the sample characteristics (mode of the distribution, skew, kurtosis, minimum/maximum value, etc.) and the accompanying psychological phenomena. Such visualizations yield a richer integrative picture of data compared with what is typically gleaned by a cursory review of the descriptive statistics and correlations, although these are also important to examine. Because information presented visually is often more engaging than numeric presentation, and because visualization simultaneously can capture multiple phenomena (e.g., modality, skew, kurtosis), methodological issues may be easier to identify with visualization than with a table of numbers.
The incorporation of GDs can promote best practices for researchers to check their data prior to submission for publication. For example, a basic checklist (cf. “Journal Article Reporting Standards”) asking authors to verify that they explicitly examined the extent to which their data meet the critical assumptions underlying the statistical tools utilized provides an efficient, additional layer of checks in the peer-review system. Thus, GDs can be used to facilitate open discussion concerning the extent to which the requisite assumptions of different statistical analyses have been satisfied (e.g., Brandt, 2012; Ullrich & Schlüter, 2012).
By including GDs in the peer-review process whenever possible, we can strengthen the quality of research by further increasing the transparency of data while maintaining a level of information privacy with minimal burden on researchers, reviewers, and editors. Importantly, GDs could help increase transparency not only in situations where data cannot be shared, but also as a supplement to data sharing — they can provide a quicker, easier-to-digest snapshot of various data issues than a raw data set is often able to provide.
GDs can enable possible detection of errors in data coding and/or influential outliers. They also can reveal important but unexplored trends that were not of immediate interest to the primary researchers. This can lead to multiple data uses for different research projects and increased opportunities for scientific collaborations.
The incorporation of GDs also can increase the use of inductive methods within psychology (Locke, 2007). The growing interest in “Big Data” is expected to foment the increased use of data visualizations, and GDs are expected to become an increasingly integral tool for uncovering new and interesting psychological phenomena (Keim, Kohlhammer, Ellis, & Mansmann, 2010).
Group Mean Differences
An example of the utility of GDs is assessing and reporting group differences — an indispensable part of psychological research. The current standard of reporting effect sizes, though helpful in interpreting findings beyond statistical significance, does not reveal whether specific data points and/or subgroups drive or obscure the effects. This may be especially important when smaller sample sizes are used and group means — which are typically used — can be vulnerable to outliers. The use of GDs can serve to elucidate potentially influential observations when conducting comparisons between group means. As illustrated in the below figure below with two groups (n = 100 per group), an initial mean-difference analysis does not reveal significant differences (t = 0.19, p > .05, d = 0.03) between the two groups. However, an examination of the density and rug plot reveals that this may be a consequence of two subgroups in Group 2, where there is a subgroup of individuals on the low end (x < −2.0) and another subgroup of individuals who are slightly higher (x ≈ .40) than Group 1. A mean-difference GD can provide a more nuanced interpretation of possible drivers of these effects (be they statistically significant or not) — effects that might go undetected using traditional reporting standards. Importantly, these effects should be cross-validated in another sample to prevent capitalizing on chance (see Fig. 1).
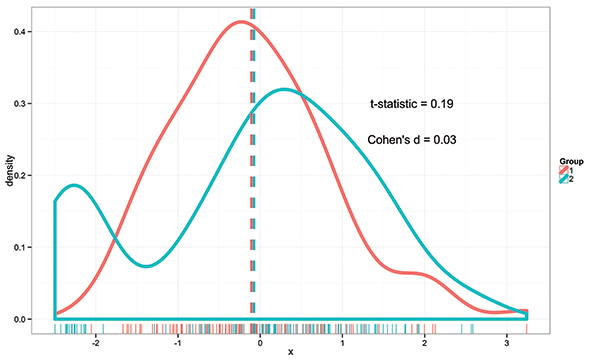 Fig. 1
We propose that by encouraging GDs as a standard in our field, we can enhance methodological transparency and rigor. One possible path to increasing the use of GDs is to include them as supplemental materials in journal submissions. Another possibility is to provide digital signatures for all submissions noting that data-analysis checks have been completed prior to manuscript submission. This also will help to promote common standards for data-assumption checks that may be shared by authors, reviewers, and the general scientific audience. To provide additional incentives, the current use of Open Practices Badges in Psychological Science and Clinical Psychological Science could be augmented to include badges for the use of GDs.
In this vein, we have developed a working website that enables researchers to generate GDs. In its current form, our website emphasizes the more rudimentary plots that are likely most useful for data that do not have sophisticated data structures (e.g., dyadic data, nested data). Moving forward, we will expand the tools available on the website so that it may be used to generate GDs for different types of data formats and structures. This would include, but not be limited to, experimental data with different designs, multilevel data, and time-series data. We also plan to expand the website to include interactive tools that facilitate researchers uploading their data to a secure website so that other researchers can interactively visualize data and, if interested, obtain permissions to collaborate on extensions with the primary authors, especially for sensitive or proprietary data. Moreover, with the growing interest in Big Data, a critical challenge for the current platform would be to provide GD tools that would be able to handle the processing demands of Big Data sets and remaining visually efficacious by utilizing techniques such as data binning and automatic scaling of plots. Finally, we are collaborating with data visualization experts to implement methods for promoting data transparency while also ensuring privacy protections so that proprietary/confidential data sets cannot be recovered wholesale from data visualizations.
We believe that there will be a growing need for GDs in the field of psychological science if we are to increase data transparency and methodological rigor. We hope that key stakeholders and researchers can join in our efforts to further the use of GDs in journals and the development of the GDs platform.
This story was adapted from a longer article published recently in Perspectives on Psychological Science, 11, 692–701. doi:10.1177/1745691616663875.
References and Further Reading
Brandt, M. (2012). Nasty data can still be real: A reply to Ullrich and Schlüter. Psychological Science, 23, 826–827.
Chang, W. (2013). R graphics cookbook: Practical recipes for visualizing data. Sebastopol, CA: O’Reilly Media.
Cohen, J., Cohen, P., West, S. G., & Aiken, L. S. (2003). Applied multiple regression/correlation analysis for the behavioral sciences (3rd Ed.). Mahwah, NJ: Erlbaum.
Cortina, J. M. (1993). What is coefficient alpha? An examination of theory and applications. Journal of Applied Psychology, 78, 98–104.
Cumming, G. (2014). The new statistics: Why and how. Psychological Science, 25, 7–29.
Funder, D. C., Levine, J. M., Mackie, D. M., Morf, C. C., Sansone, C., Vazire, S., & West, S. G. (2014). Improving the dependability of research in personality and social psychology recommendations for research and educational practice. Personality and Social Psychology Review, 18, 3–12.
Keim, D. A., Kohlhammer, J., Ellis G., & Mansmann F. (Eds.). (2010). Mastering the information age: Solving problems with visual analytics. Goslar, Germany: Eurographics Association.
Locke, E. A. (2007). The case for inductive theory building. Journal of Management, 33, 867–890.
Murrell, P. (2011). R graphics (2nd Ed.). London, UK: Chapman & Hall.
Nosek, B., & Lakens, D. (2014). Registered reports: a method to increase the credibility of published results. Social Psychology, 45, 137–141.
Open Science Collaboration. (2012). An open, large-scale, collaborative effort to estimate the reproducibility of psychological science. Perspectives on Psychological Science, 7, 657–660.
Simmons, J. P., Nelson, L. D., & Simonsohn, U. (2011). False-positive psychology: Undisclosed flexibility in data collection and analysis allows presenting anything as significant. Psychological Science, 22, 1359–1366.
Ullrich, J., & Schlüter, E. (2012). Detecting nasty data with simple plots of complex models: Comment on Brandt (2011). Psychological Science, 23, 824–825.

