
Practice
Cultural and Psychological Distance: Beyond Weirdness

The “truths” psychological science has uncovered over the years may be those of very few people—those who live in Western, educated, industrialized, rich, and democratic (WEIRD) nations. Most psychological science research is conducted within these countries, making it difficult to generalize the findings to the rest of the world.
The obvious solution to this issue is to make psychological science more inclusive of non-WEIRD samples and non-WEIRD researchers. Beyond this, a systematic method for measuring how culturally and psychologically different societies are can also contribute to pushing psychological science beyond WEIRDness. In a 2020 article published in Psychological Science, Michael Muthukrishna, of the London School of Economics and Political Science, and colleagues presented a method and tool for measuring the psychological and cultural distance between populations.
“We hope that this technique and tool may guide researchers in selecting sites and samples that are sufficiently culturally different to test the generalizability of their hypotheses,” Muthukrishna and colleagues wrote. “A more general theory of human behavior requires a theoretical and empirical understanding of humans across the globe and across the life span.”
The need for knowledge about cultural distance
When researchers attempt to assess the generalizability of their findings, they often compare Western nations with East Asian nations (e.g., China, Japan). Although researchers are increasingly attempting to test their hypotheses in other societies (see, e.g., Henrich et al., 2010), psychological science remains mostly WEIRD. Moreover, even WEIRD nations differ culturally, a fact not addressed by a science that has disproportionately used samples from the United States.
As Muthukrishna and colleagues wrote, citing the work of Boyd (2017), Gelfand (2019), and Henrich (2016), “A growing body of theoretical and empirical work in cultural evolution emphasizes that our species is fundamentally cultural, and thus, these cultural differences are also psychological differences: from norms and attitudes, to the degree to which these norms are enforced, to low-level perception of color and visual illusions.”
Thus, an important question to address is how psychologically different the nations of the world are, compared to each other and to overstudied WEIRD nations like the United States. A tool that allows researchers to systematically calculate cultural and psychological differences among nations can help to assess the generalizability of their findings and can indicate whether—and where—more testing is needed.
Development of the tool
Muthukrishna and colleagues’ tool for quantifying psychological and cultural distance between nations is available at culturaldistance.com (and also on a new website—world.culturalytics.com). Researchers can also use R code to implement the tool (for details, see the supplemental material for their article).
The tool measures cultural distance using the cultural fixation index (CFST). The CFST is calculated in the same manner as the fixation index (FST), a measure of genetic variance used in population biology. Instead of reflecting variance in alleles within a genome, the CFST reflects variance in answers to questions from large surveys of cultural values (Bell et al., 2009).
The CFST can be used to identify regional, national, or other cultural groupings (e.g., class differences) and to determine the distance between two groups with respect to cultural dimensions such as politics, social relations, or beliefs.
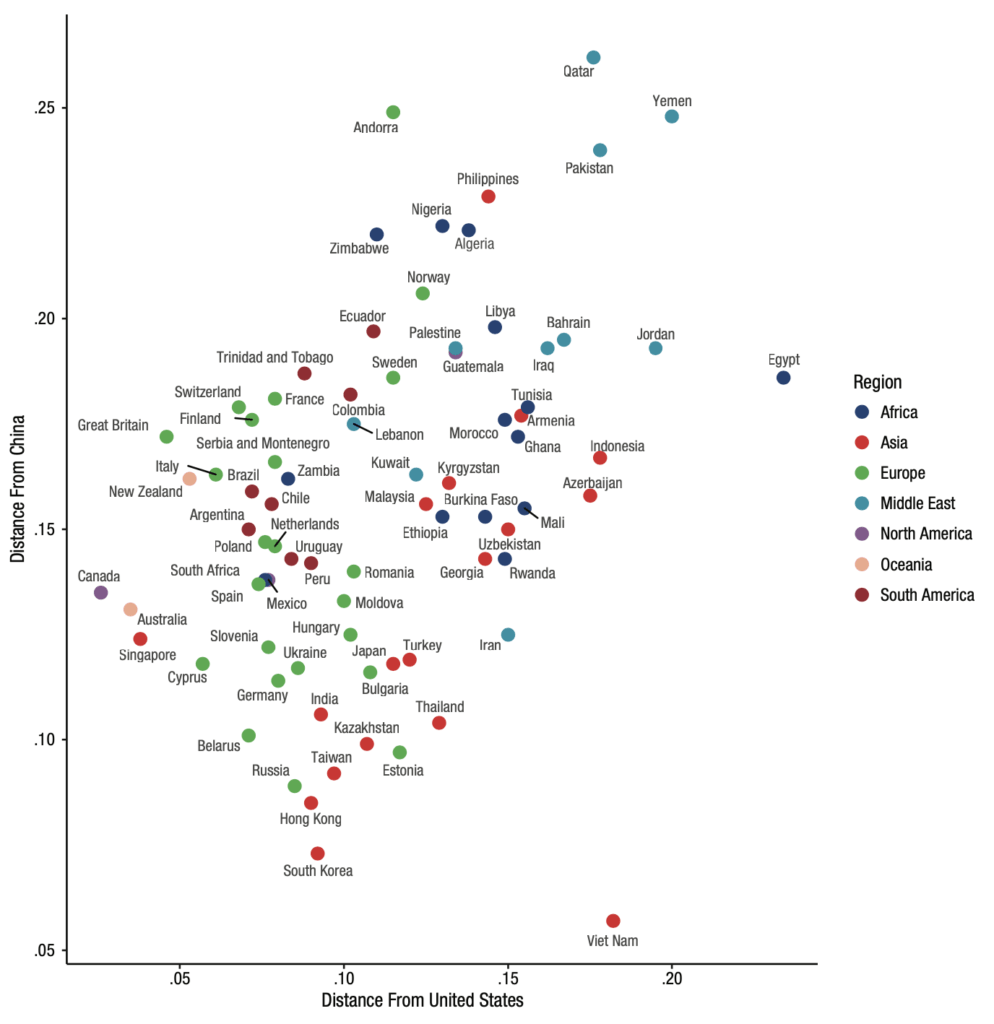
As examples, in their 2020 article, Muthukrishna and colleagues used an American scale to calculate countries’ cultural distance from the United States and a Chinese scale to calculate countries’ cultural distance from China (see Figure 1).
How to use the online tool
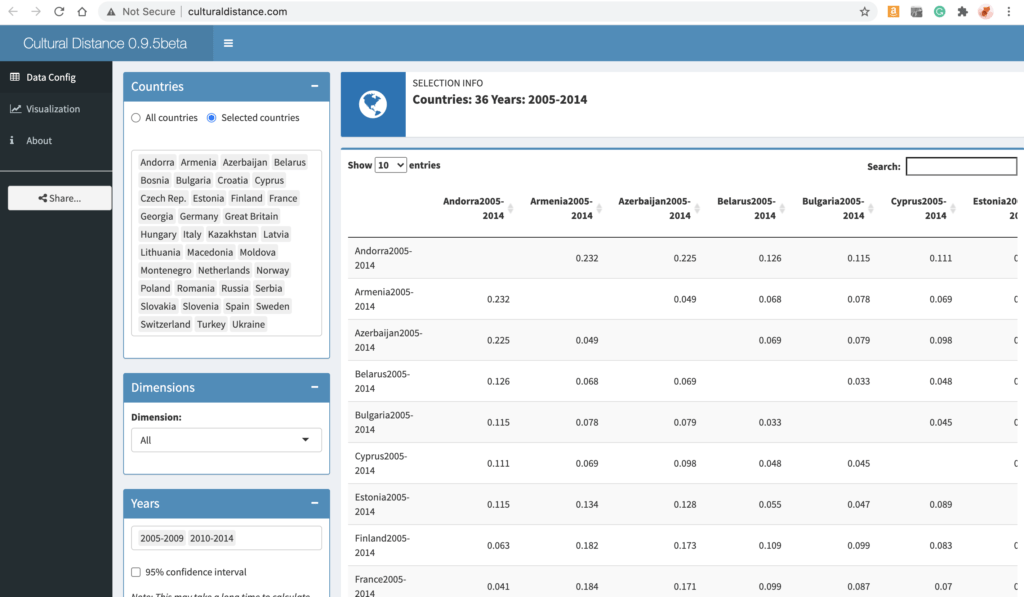
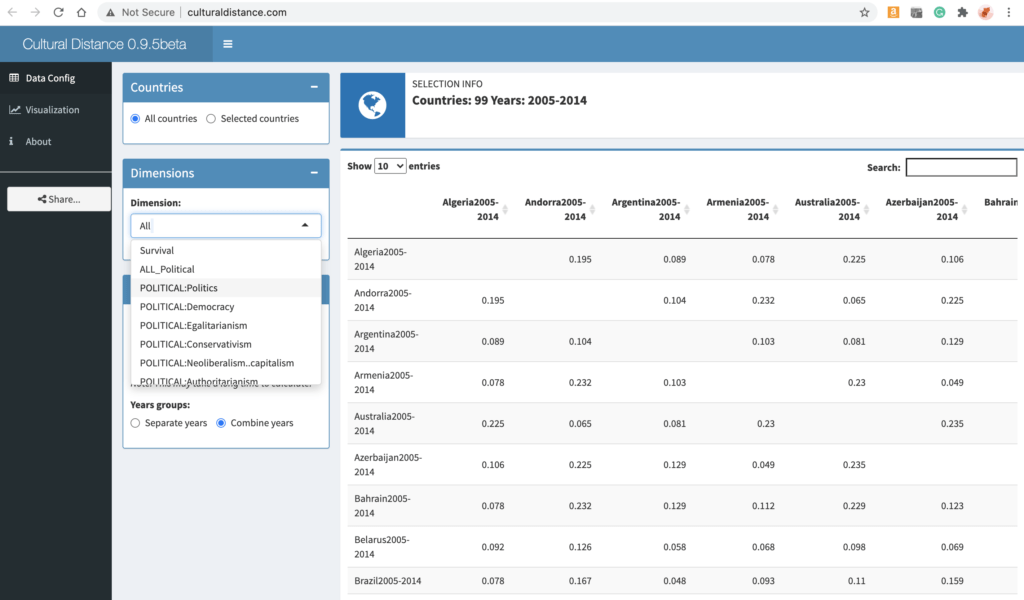
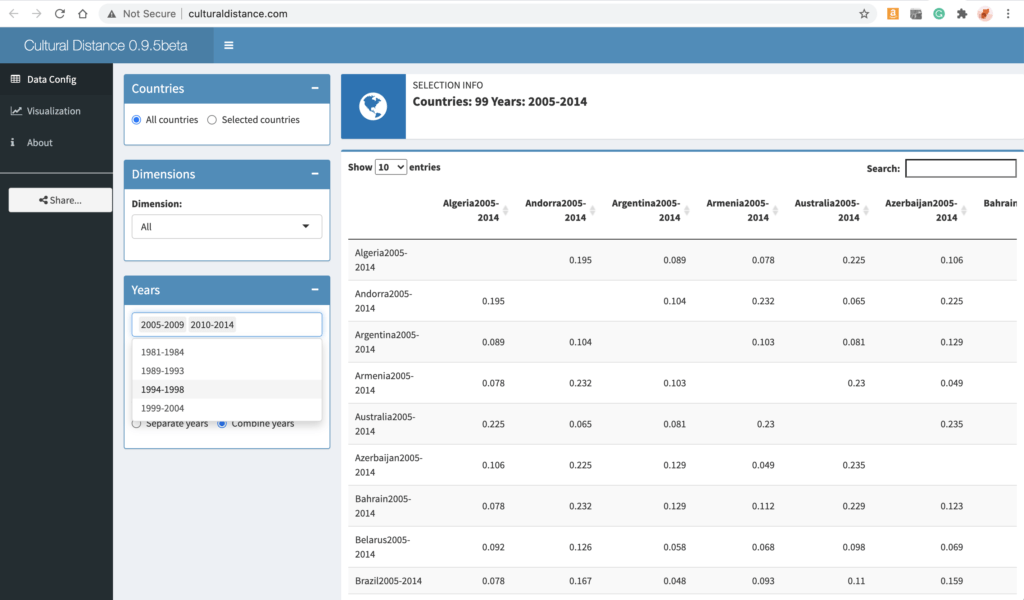
Computing the cultural distance between countries on www.culturaldistance.com is fairly easy. The user needs only to select the countries they would like to compare (Figure 2), the dimensions or aggregates of dimensions they would like to compare those countries on (Figure 3), and the years of the comparisons (Figure 4). The result is a table that can be downloaded and analyzed in Excel. The website also offers data visualization in the form of stackable histograms and density graphics (Figure 5).
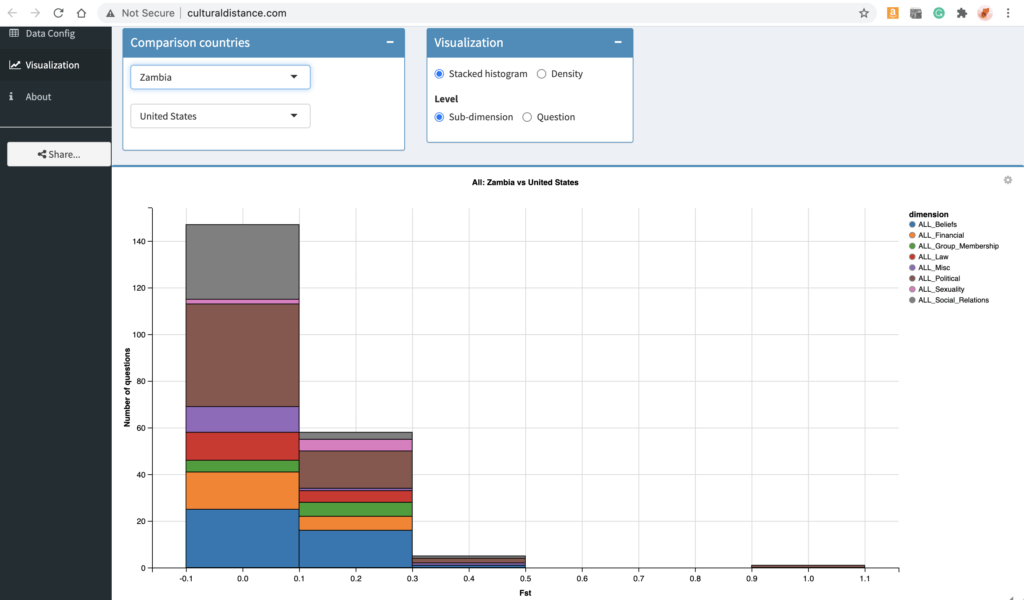
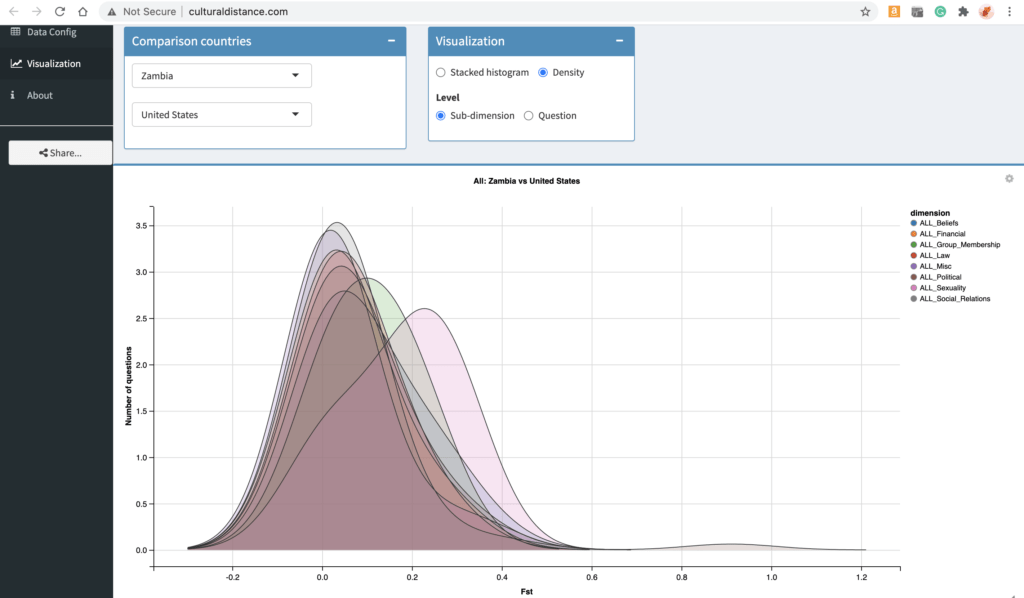
The dimensions addressed in the tool pertain to seven major categories: political (nine dimensions), group membership (four dimensions), beliefs (four dimensions), social relations (four dimensions), law (three dimensions), financial (two dimensions), sexuality (two dimensions), and a miscellaneous category that includes consumerism, leisure/recreation/hobbies, arts and creativity, and science and innovation.
References
Bell, A. V., Richerson, P. J., & McElreath, R. (2009). Culture rather than genes provides greater scope for the evolution of large-scale human prosociality. Proceedings of the National Academy of Sciences, USA, 106(42), 17671–17674. https://doi.org/10.1073/pnas.0903232106
Boyd, R. (2017). A different kind of animal: How culture transformed our species. Princeton University Press.
Gelfand, M. (2019). Rule makers, rule breakers: Tight and loose cultures and the secret signals that direct our lives. Scribner.
Henrich J. (2016). The secret of our success: How culture is driving human evolution, domesticating our species, and making us smarter. Princeton University Press.
Henrich, J., Heine, S. J., & Norenzayan, A. (2010). The weirdest people in the world? Behavioral and Brain Sciences, 33(2–3), 61–83. https://doi.org/10.1017/S0140525X0999152X
Muthukrishna, M., Bell, A. V., Henrich, J., Curtin, C. M., Gedranovich, A., McInerney, J., & Thue, B. (2020). Beyond Western, educated, industrial, rich, and democratic (WEIRD) psychology: Measuring and mapping scales of cultural and psychological distance. Psychological Science, 31(6), 678–701. https://doi.org/10.1177/0956797620916782


APS regularly opens certain online articles for discussion on our website. Effective February 2021, you must be a logged-in APS member to post comments. By posting a comment, you agree to our Community Guidelines and the display of your profile information, including your name and affiliation. Any opinions, findings, conclusions, or recommendations present in article comments are those of the writers and do not necessarily reflect the views of APS or the article’s author. For more information, please see our Community Guidelines.
Please login with your APS account to comment.