
Equivalence Testing With TOSTER
Any science that wants to be taken seriously needs to be able to provide support for the null hypothesis. I often see people switching over from frequentist statistics when effects are significant to the use of Bayes factors to be able to provide support for the null hypothesis. But it is possible to test if there is a lack of an effect using p values. (Why no one ever told me this in the 11 years I worked in science is beyond me). It’s as easy as doing a t test, or, more precisely, as doing two t tests.
I’ve created my first R package, TOSTER (as in Two One-Sided Tests for Equivalence in R). Don’t worry, there is also an old-fashioned spreadsheet available as well (see “TOSTER Materials,” below).
Sometimes you perform a study where you might expect the effect to be zero or very small. So how can we conclude an effect is “zero or very small”?
One approach is to specify effect sizes we consider “not small.” For example, we might decide that effects larger than d = 0.3 (or smaller than d = –0.3 in a two-sided t test) are “not small.” Now, if we observe an effect that falls between the two equivalence bounds of d = –0.3 and d = 0.3, we can act (in the good old-fashioned Neyman–Pearson approach to statistical inferences) as if the effect is “zero or very small.” It might not be exactly zero, but it is small enough.
We can use two one-sided tests to statistically reject effects ≤ –0.3 and ≥ 0.3. This is the basic idea of the TOST (two one-sided tests) equivalence procedure.
The idea is simple, and it is conceptually similar to the traditional null-hypothesis test you probably already use to reject an effect of zero. But whereas all statistics programs will allow you to perform a normal t test, it is not so simple to perform a TOST equivalence test.
Psychological science really needs a way to show effects are too small to matter (see Morey & Lakens, 2016). So I made a spreadsheet and R package to perform the TOST procedure. The free TOSTER package is available from the Comprehensive R Archive Network (CRAN), which means you can install it using install.packages(“TOSTER”).
Let’s try a practical example using the vignette that comes along with the R package.
Eskine (2013) showed that participants who had been exposed to organic food were substantially harsher in their moral judgments relative to those in the control condition (d = 0.81, 95% confidence interval: [0.19, 1.45]). A replication by Moery and Calin-Jageman (2016, Study 2) did not observe a significant effect (control: n = 95, M = 5.25, SD = 0.95; organic food: n = 89, M = 5.22, SD = 0.83). The authors used Uri Simonsohn’s recommendation to power their study so that they had 80% power to detect an effect that the original study had 33% power to detect. This is the same as saying: We consider an effect to be “small” when it is smaller than the effect size the original study had 33% power to detect.
With n = 21 in each condition, Eskine had 33% power to detect an effect of d = 0.48. This is the effect the authors of the replication study designed their experiment to detect. The original study had shown an effect of d = 0.81, and the authors performing the replication decided that an effect size of d = 0.48 would be the smallest effect size they would aim to detect with 80% power. So we can use this effect size as the equivalence bound. We can use R to perform an equivalence test:
                               install.packages("TOSTER")
library("TOSTER")
TOSTtwo(m1=5.25, m2=5.22, sd1=0.95, sd2=0.83, n1=95, n2=89, low_eqbound_d=-0.43, high_eqbound_d=0.43, alpha = 0.05)

# Which gives us the following output:

Using alpha = 0.05 Student's t-test was non-significant, t(182) = 0.2274761, p = 0.8203089

Using alpha = 0.05 the equivalence test based on Student's t-test was significant, t(182) = -3.026311, p = 0.001417168

TOST results:
  t-value 1    p-value 1 t-value 2   p-value 2  df
1  3.481263 0.0003123764 -3.026311 0.001417168 182

Equivalence bounds (Cohen's d):
  low bound d high bound d
1       -0.48         0.48

Equivalence bounds (raw scores):
  low bound raw high bound raw
1    -0.4291159      0.4291159

TOST confidence interval:
  Lower Limit 90% CI raw Upper Limit 90% CI raw
1             -0.1880364              0.2480364
You see, we are just using R like a fancy calculator, entering all the numbers in a single function. But I can understand if you are a bit intimidated by R. So, you can also fill in the same info in the spreadsheet.
Using a TOST equivalence procedure with α = .05 and without assuming equal variances (because when sample sizes are unequal, you should report Welch’s t test by default), we can reject effects larger than d = 0.48, t(182) = –3.03, p = .001.
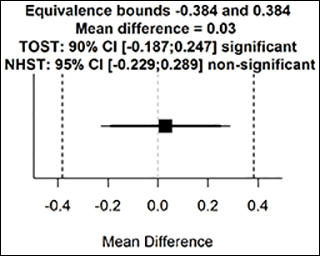
The R package also provides a graph, displaying the observed mean difference (in raw scale units), the equivalence bounds (also in raw scores), and the 90% and 95% CIs. If the 90% CI does not include the equivalence bounds, we can declare equivalence.
Moery and Calin-Jageman concluded from this study: “We again found that food exposure has little to no effect on moral judgments.” But what is “little to no”? The equivalence test tells us the authors successfully rejected effects of a size the original study had 33% power to reject. Instead of saying “little to no,” we can put a number on the effect size we have rejected by performing an equivalence test.
If you want to read more about equivalence tests, including how to perform them for one-sample t tests, dependent t tests, correlations, or meta-analyses, you can check out a practical primer on equivalence testing using the TOSTprocedure I’ve written. It’s available as a preprint on PsyArXiv. The R code is available on GitHub.
Daniel Lakens will speak at the 2017 APS Annual Convention, May 25–28, 2017, in Boston, Massachusetts. He also will speak at the International Convention of Psychological Science, March 23–25, 2017, in Vienna, Austria.
TOSTER Materials
The TOSTER spreadsheet is available here.
The TOSTER R package can be installed from CRAN using install.packages(“TOSTER”).
The practical primer on equivalence testing using the TOST procedure is available here.
The R code is available here.
Detailed example vignettes are available here.
References
Eskine, K. J. (2013). Wholesome foods and wholesome morals? Organic foods reduce prosocial behavior and harshen moral judgments. Social Psychological and Personality Science, 4, 251–254. doi:10.1177/1948550612447114
Lakens, D. (2015). Always use Welch’s t-test instead of student’s t-test. Retrieved from http://daniellakens.blogspot.nl/2015/01/always-use-welchs-t-test-instead-of.html
Lakens, D. (2016a). Introduction to equivalence testing with TOSTER. Retrieved from https://cran.rstudio.com/web/packages/TOSTER/vignettes/IntroductionToTOSTER.html
Lakens, D. (2016b). TOST equivalence testing R package (TOSTER) and spreadsheet. Retrieved from http://daniellakens.blogspot.com/2016/12/tost-equivalence-testing-r-package.html
Lakens, D. (in press). Equivalence tests: A practical primer for t-tests, correlations, and meta-analyses. Social Psychological and Personality Science.
Moery, E., & Calin-Jageman, R. J. (2016). Direct and conceptual Replications of Eskine (2013): Organic food exposure has little to no effect on moral judgments and prosocial behavior. Social Psychological and Personality Science, 7, 312–319. doi: 10.1177/1948550616639649
Morey, R. D., & Lakens, D. (2016). Why most of psychology is statistically unfalsifiable. Retrieved from https://raw.githubusercontent.com/richarddmorey/psychology_resolution/master/paper/response.pdf

