
Run All the Models! Dealing With Data Analytic Flexibility
Imagine you are trying to figure out whether the personality traits of firstborns systematically differ from those of younger siblings. You set about planning your analyses, a seemingly straightforward task that quickly raises a multitude of questions. Is there any need to control for third variables? How do you handle the fact that the number of siblings varies? What exactly does “firstborn” mean when some people have half- or step-siblings? And what about the age gaps between siblings — does it make a difference if the firstborn is barely a year older than the younger sibling compared with siblings who are separated by a gap of 10 years? Different answers to such questions will lead to different analyses.
What began as a simple question leads to a large number of potential ways to analyze the data, a large number of so-called “researcher degrees of freedom.” The right data analytic strategy might hinge on details of the hypothesis or on additional assumptions. If the hypothesis is vague, or if we lack crucial pieces of theoretical knowledge to decide which set of assumptions is more plausible, various approaches to running an analysis might be justifiable.
Taken by itself, this is not problematic: There is no reason why there should be a single correct way to analyze data. But over the last several years, psychological scientists have learned that this flexibility can cause problems if it is tackled the wrong way. If researchers try different analyses and selectively report those that yield the desired outcome — most often, a “significant” effect with a p-value below the conventional threshold of .05 — the published literature may contain a substantial number of false-positive findings.
A coin-flip example shows how selective reporting can influence the conclusions we draw. Imagine I told you that I flipped a coin 10 times and that it showed heads 10 times in a row. I even show you video proof! You might suspect that the coin is rigged rather than fair: The probability of such a lucky streak using a fair coin is p = 50%10, only about 0.1% (i.e., p < .001).
Imagine you later found out that I had actually started with 1,000 coins, each of which I flipped 10 times. I selected the lucky coin from these 1,000 coins and presented it to you. Would you still suspect that this particular coin is rigged? Would you be willing to bet that the coin keeps showing mostly heads — in other words, that the peculiar pattern replicates? Probably not. If all 1,000 coins were fair, it is likely that at least one of them shows such a pattern. In fact, it is more likely to observe at least one such lucky streak than to not observe it.1
Taking a closer look at the literature on birth order and personality, it seems that some researchers have (metaphorically speaking) tossed a few more coins than they have disclosed in their papers. In a 1999 paper, Harris pointed out this “divide-and-conquer” method of birth order research: “Significant birth order effects were found for males but not for females, or vice versa. Or for middle-class subjects but not for working class, or vice versa. Or for people from small families but not from large ones, or for high school students but not college-age subjects. Researchers thought of some ingenious ways to divide up the data. Birth order effects were found in one study only if ‘firstborns’ was defined as ‘firstborns of that sex.’ In another, birth order effects were found only for high-anxiety subjects.”
Given these practices, it is no surprise that findings are often contradictory. In a 2017 study published in Psychological Science, Boris Egloff, Stefan Schmukle, and I tried to tease apart these conflicting findings, examining a literature that one of our reviewers described as “a complete mess.” Given the large number of researcher degrees of freedom in birth order research, we used a data-analytic approach called Specification Curve Analysis, first described by Simonsohn, Simmons, and Nelson in 2015. The idea behind Specification Curve Analysis is simple: If you can come up with a large number of defensible ways to analyze the data, run all of them and evaluate the results across all analyses. This allows researchers to probe whether robust effects emerge across different analyses and whether the null hypothesis of no effect can be rejected.
We used data from the Socio-Economic Panel study (SOEP), a longitudinal study in which members of German households fill out a yearly set of extensive questionnaires. First, we had to decide which outcome variables to include. Over the years, the SOEP has asked respondents a hodgepodge of questions about their personality. We decided to look at the personality data that had been collected between 2010 and 2014.
We also needed to come up with reasonable ways to analyze the data to decide which model specifications to include — for this, we used the published literature as a guide. For example, we decided to include separate analyses depending on the number of siblings a respondent has, because effects that only occur in families of specific sizes have been reported in previous studies. Researchers have also suggested that the age gaps between siblings matter, so we tried different exclusion criteria, dropping siblings who were born too close in time and also those who were too far apart. Some studies control for age, others do not — we tried both. Combining all of these decisions led to at least 720 different models for each outcome variable.
We ran all of these models.2 As you can estimated effects. You can see such a curve for the outcome variable “positive reciprocity” (a tendency to pay back favors) in Figure 1. The red bars indicate that an effect passed the conventional significance threshold of p < .05.
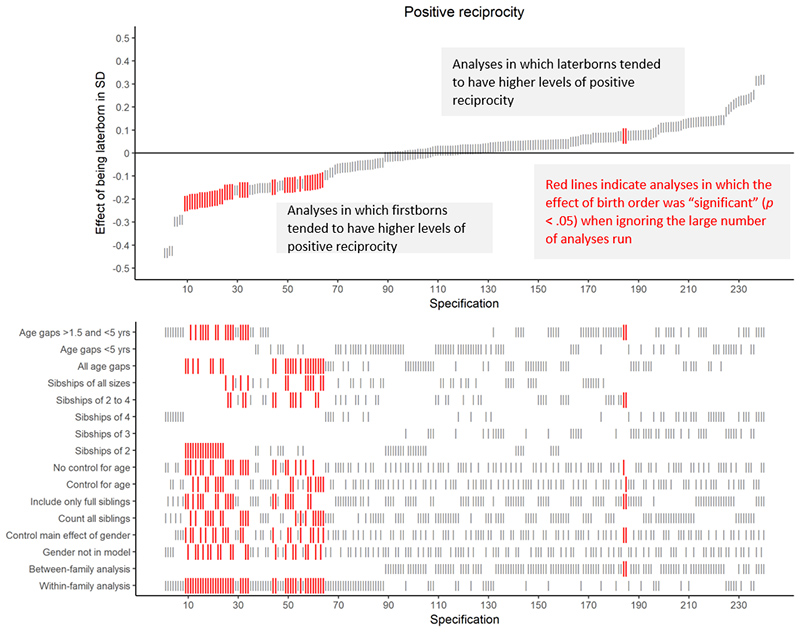
Figure 1. This Specification Curve reflects hundreds of models employed in research on birth order and personality. The red bars indicate that an effect passed the conventional significance threshold of p < .05.
The effects that emerged were all over the place: Some indicate that so-called laterborns score lower on positive reciprocity, others indicate the opposite.
Hypothetically, we could have picked a single significant result and devised a just-so story, arguing that firstborn children are more likely to identify with parents who try to enforce norms of positive reciprocity among their offspring, so we expect them to have internalized these norms and thus to score higher on positive reciprocity.
If we had picked an effect pointing into the opposite direction, we could have explained it by suggesting that laterborn children crucially depend on social cooperation to defend their vulnerable position against the physically superior firstborn children, so we expect them to score higher on positive reciprocity.
As we now know, such an approach to data analysis is highly problematic because it favors findings that are not replicable. Instead, we looked at the bigger picture: Approximately 10% of the specifications result in a significant effect. Is that more or less than what we would expect by chance if there was no effect?
To answer this, we used a permutation test as suggested by Simonsohn, Simmons, and Nelson in their 2015 paper. We generated 500 data sets under the null hypothesis (no systematic effect of birth order) by randomly shuffling the birth-order position variable; then we compared the empirical Specification Curve to the simulated data. In the simulated datasets, birth order has been randomly assigned to individuals, and thus it cannot possibly correlate with their actual personality beyond chance variations.
For positive reciprocity, our empirical curve resulted in 10% “significant” specifications. Seventy-seven of the shuffled samples resulted in an equal (or greater) percentage of significant specifications, so the overall p-value is 77/500 = .154. According to this, the curve does not give us a strong reason to reject the notion that birth order has no effect on positive reciprocity.
Likewise, we found little evidence for birth order effects on a number of other personality variables, including negative reciprocity, life satisfaction, locus of control, risk taking, patience, impulsivity, and political orientation.
imagine, this number of analyses creates a lot of output. One way to make sense of all these numbers is plotting a Specification Curve that visualizes the Specification Curve Analysis seemed particularly suited for this specific research question, but it is not the only way to deal with researcher degrees of freedom. For example, considerable analytic flexibility arises if outcome measures are not standardized. In such cases, having researchers agree upon and use a standardized version can prevent unreliable findings.
Flexibility might also arise during data collection, for example, if researchers peek at the results and decide whether or not to collect more data (or whether to label the study a “failed pilot”). In such cases, a detailed preregistration can tame researcher degrees of freedom.
Last but not least, more rigorous theories could partly fix the problem: If predictions are precise, data analysis becomes less arbitrary.
1 The chance that a fair coin shows only heads when you flip it 10 times is 50%^10. Thus, the chance that the coin does not show heads 10 times in a row is 100%-(50%^10), or about 99.90%. Now, the chance that none of the 1,000 coins shows heads 10 times in a row is (100%-(50%^10))^1000, about 37.64%. That means that the chance that at least one of the 1,000 coins shows heads 10 times in a row is 100%-37.64% = 62.36%.
2 Currently, there is no software package for Specification Curve Analysis, so I wrote some R scripts to do the job. You can find them on the OSF page of the article, but they are not particularly efficient and not easily modified. Uri Simonsohn has been working on a package, but this might still take some time. If you want to run a Specification Curve Analysis, I would recommend that you try to implement it yourself or team up with somebody with programming skills.
References and Further Reading
Elson, M., Mohseni, M. R., Breuer, J., Scharkow, M., & Quandt, T. (2014). Press CRTT to measure aggressive behavior: The unstandardized use of the competitive reaction time task in aggression research. Psychological Assessment, 26, 419–432. doi:10.1037/a0035569
Harris, J. R. (1999). The nurture assumption: Why children turn out the way they do. New York, NY: Free Press.
Nosek, B. A., Ebersole, C. R., DeHaven, A., & Mellor, D. (2017). The Preregistration Revolution. Retrieved from https://osf.io/2dxu5/
Rohrer, J. M., Egloff, B., & Schmukle, S. C. (2017). Probing birth-order effects on narrow traits using specification-curve analysis. Psychological Science, 28, 1821–1832. doi:0956797617723726.
Simonsohn, U., Simmons, J. P., and Nelson, L. D. (2015). Specification curve: Descriptive and inferential statistics on all reasonable specifications. Retrieved from https://ssrn.com/abstract=2694998 or http://dx.doi.org/10.2139/ssrn.2694998
Simmons, J. P., Nelson, L. D., & Simonsohn, U. (2011). False-positive psychology: Undisclosed flexibility in data collection and analysis allows presenting anything as significant. Psychological science, 22, 1359–1366.
Wagner, G. G., Frick, J. R., & Schupp, J. (2007). The German socio-economic panel study (SOEP) scope, evolution, and enhancements. Journal of Applied Social Science Studies, 127, 139–169.


Comments
Decades ago, I read an article in the New Yorker about the strategic command and control of the US nuclear forces. In it, they described the concept of “dual phenomenology” in the context of detecting a Soviet missile launch. Basically, only confirm the launch if cldetected by two technologies that don’t share a common, confounding influence. I’ve used that analogy in supervising my trainees’ work since and appears consistent with the approach described here. Of course, the “dual phenomenology” was in respect to detection via identification by two out of two different technologies. Many fewer “researcher degrees-of-freedom” there. Still, I find it a useful analogy.
APS regularly opens certain online articles for discussion on our website. Effective February 2021, you must be a logged-in APS member to post comments. By posting a comment, you agree to our Community Guidelines and the display of your profile information, including your name and affiliation. Any opinions, findings, conclusions, or recommendations present in article comments are those of the writers and do not necessarily reflect the views of APS or the article’s author. For more information, please see our Community Guidelines.
Please login with your APS account to comment.