Student Notebook
Understanding Confidence Intervals (CIs) and Effect Size Estimation
Asking the Right Question
One of the many problems with null hypothesis significance testing (NHST) is that it encourages dichotomous thinking: Either an effect is statistically significant or it’s not (Kline, 2004). Using a p value to merely test if there is a significant difference between groups does little to progress science. Surely a more informative and interesting question to ask is “How big is the effect?” or “How strong is the relationship?” CIs give us a method for answering such questions.
Defining a CI
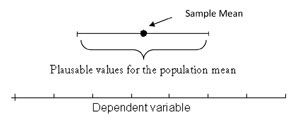
A good way to think about a CI is as a range of plausible values for the population mean (or another population parameter such as a correlation), calculated from our sample data (see Figure 1). A CI with a 95 percent confidence level has a 95 percent chance of capturing the population mean. Technically, this means that, if the experiment were repeated many times, 95 percent of the CIs would contain the true population mean. CIs are ideally shown in the units of measurement used by the researcher, such as proportion of participants or milligrams of nicotine in a smoking cessation study. This allows readers to assign practical meaning to the values (Cumming & Finch, 2005).
 Figure 1: You can be reasonably sure that the population mean will be somewhere in the range shown by the CI.
Application of CIs
CIs not only give the reader an easy-to-interpret range estimate of the population mean, they also give information about the “precision” of an estimate. Think of precision as a measure of uncertainty associated with our estimate. An uncertain estimate using a 95 percent CI would be quite wide, whereas a more certain estimate using a 95 percent CI will be much smaller and therefore more precise.
CIs can be used directly in a meta-analysis and in meta-analytic thinking (Cumming & Finch, 2001), which considers effects across studies rather than focusing on just one result of one study. The importance of replication in research has been increasingly emphasized, particularly in the social sciences (Thompson, 1996). A CI provides the necessary information needed when conducting a meta-analysis and, most importantly, allows a researcher to immediately compare a current result with CIs from previous studies.
CIs can also be used to test hypotheses when necessary. Any point outside the 95 percent CI can be used as support in rejecting the null hypothesis at p < .05, two-tailed. If you widen the CI to 99 percent, any point outside the interval implies statistical significance at p < .01, two-tailed. You can easily estimate a p value from a CI; however, you cannot estimate a CI from a p value. Essentially, CIs offer everything that p values offer and far more.
Planning an Adequate Sample Size for a Precise CI
Researchers often express concern about avoiding wide CIs. Wide CIs mean that there is not enough data or that the data are too variable to make a precise estimate. Proper planning can increase the likelihood of a precise interval. Much like an a priori power analysis, a researcher can estimate the number of participants required for a desired expected width. The simplest method for planning the width of your CI is the precision approach, in which you place the standard deviation (or an estimate if it is unknown) and your desired margin of error (the half width of your CI) into the following equation:

N is the number of participants, δ is the standard deviation of the population, Z is the Z score for the level of confidence (for example, 1.96 for a 95 percent CI), and W is the margin of error of the CI. This margin of error will be your desired half width in the units in which you are measuring your dependant variable (e.g., meters, points on a depression scale, or a standardized effect size such as Cohen’s d). This equation can replace the use of a power calculation to determine sample size.
Watch out! Common Misconceptions
Definitional misconceptions. Fidler (2005) found that some students believed a CI to be a range of plausible values for the sample mean, a range of individual scores, or a range of individual scores within one standard deviation. Remember, a CI is an estimate of plausible values for the population mean.
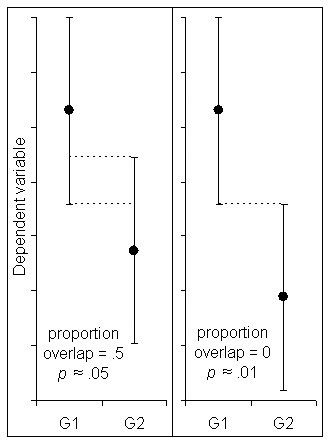
The overlap misconception. The overlap misconception is a belief that, when comparing means for two independent groups, the means are statistically significantly different at p < .05 when the 95 percent CIs around the means are just touching. In actuality, CIs for independent groups are at p ≈ .05 when they overlap by about ¼ (Figure 2; Cumming & Finch, 2005). When the 95 percent CIs are just touching (no overlap), p ≈ .01. This, however, does not apply to repeated or paired design statistics. For repeated or paired designs, you should create a CI around the difference between the groups.
The confidence level misconception. Some believe that a 95 percent CI for an initial experiment has a 95 percent chance of capturing the sample mean for a repeat of the experiment. This would only be true if the initial sample mean landed directly on the population mean. In fact, the average probability of the first 95 percent CI capturing the next sample mean is around 83 percent (Cumming, Williams, & Fidler, 2004).
 Figure 2: The CIs on the left overlap by about 1/4, half the average margin of error, which corresponds to a p value of ≈ .05. The CIs on the right are just touching. This corresponds toa p value of ≈ .01 (Cumming and Finch, 2005).
Tips for Interpreting CIs
- Take note of what is most important to the study. What is the magnitude of the effect? Don’t just focus on the statistical significance; is the effect practically important?
- How precise is the CI, and what does this tell us about the design of the study? A precise CI can give a very good estimate of the population parameter.
- The center of the CI (the sample mean) is the most plausible value for the population mean. The ends of the CI are less plausible values for the population mean.
- When using a repeated measures or a paired group design, do not compare the CIs of the group means or of the pre-test and post-test scores because there will be no meaningful interpretation. Instead, use a CI around the mean difference.
- As discussed above, p values can be estimated from the graphs of the confidence intervals of two independent sample means. If the CIs overlap by half a margin of error, then p ≈ .05. When they are just touching, then p ≈ .01. See Figure 2 for an illustration.
To learn more about presenting, graphing, and interpreting CIs for several research designs, see Finch and Cumming (2001) and Cumming and Finch (2005). For advice on creating CIs for non-central distributions, such as when doing F, d, R-squared tests, see Fidler and Thompson (2001). Many researchers are currently developing ways of using CIs for multivariate statistics. Although p values and NHST are still the most common methods for reporting results, psychology is moving toward effect size estimation. What could be simpler (or more important) to report and interpret than an estimate of the population mean?
References
American Psychological Association. (2009). Publication manual of the American Psychological Association (6th ed.). Washington, DC.
Belia, S., Fidler, F., Williams, J., & Cumming, G. (2005). Researchers misunderstand confidence intervals and standard error bars. Psychological Methods, 10, 389-396.
Cumming, G., & Finch, S. (2001). A primer on the understanding, use and calculation of confidence intervals based on central and noncentral distributions. Educational and Psychological Measurement, 61, 530-572.
Cumming, G., & Finch, S. (2005). Inference by eye: Confidence intervals, and how to read pictures of data. American Psychologist, 60, 170–180.
Cumming, G., Williams, J., & Fidler, F. (2004). Replication and researchers’ understanding of confidence intervals and standard error bars. Understanding Statistics, 3, 299–311.
Fidler, F. (2005). From statistical significance to effect estimation: Statistical reform in psychology, medicine and ecology. Department of History and Philosophy of Science, University of Melbourne. Retreived from http://www.botany.unimelb.edu.au/envisci/docs/fidler/fidlerphd_aug06.pdf.
Fidler, F., & Thompson, B. (2001). Computing correct confidence intervals for ANOVA fixed and random effect sizes. Educational and Psychological Measurement, 61, 575-604.
Rao, S., Fein, D., Seidman, L., & Tranel, D. (2008). Editorial. Neuropsychology, 22, 1-2.
Thompson, B. (1996). AERA editorial policies regarding statistical significance testing: Three suggested reforms. Educational Researcher, 25, 26–30.


APS regularly opens certain online articles for discussion on our website. Effective February 2021, you must be a logged-in APS member to post comments. By posting a comment, you agree to our Community Guidelines and the display of your profile information, including your name and affiliation. Any opinions, findings, conclusions, or recommendations present in article comments are those of the writers and do not necessarily reflect the views of APS or the article’s author. For more information, please see our Community Guidelines.
Please login with your APS account to comment.